


Did the Afternoon Warmth Slow the Later Waves at the 2026 New York City Marathon?
Based on the 61,018 finishers mapped in this package. Weather from the National Weather Service station in Central Park.
Race day was clear and almost still. The wind in Central Park never rose above about , so the one condition that changed through the day was the temperature. It was just before the first wave left at 9:10 a.m., by noon and between about 1:50 and 2:50 p.m., when the last two waves were in Brooklyn and Queens.
That rise fell mostly on the later starters. The median first-wave runner ran the second half of the race at about ; the median fourth- and fifth-wave runners at about . It is not a large difference, and a rise of across a whole day is mild by marathon standards.
Whether it slowed anyone down is harder to say than it looks. Among runners who reached halfway in 1:55 to 2:00, those in the first wave ran their second half 8.5 percent slower than their first, and those in the fifth wave 12.5 percent slower, a gap consistent with the warmer afternoon. But among slower runners, the pattern fades and then reverses, and wave assignments are based on each runner’s expected finish time, which ties the wave a runner started in to how well their race went. The data shows that later starters ran in somewhat warmer air; it cannot cleanly separate the effect of a few degrees from everything else that differs between the waves.
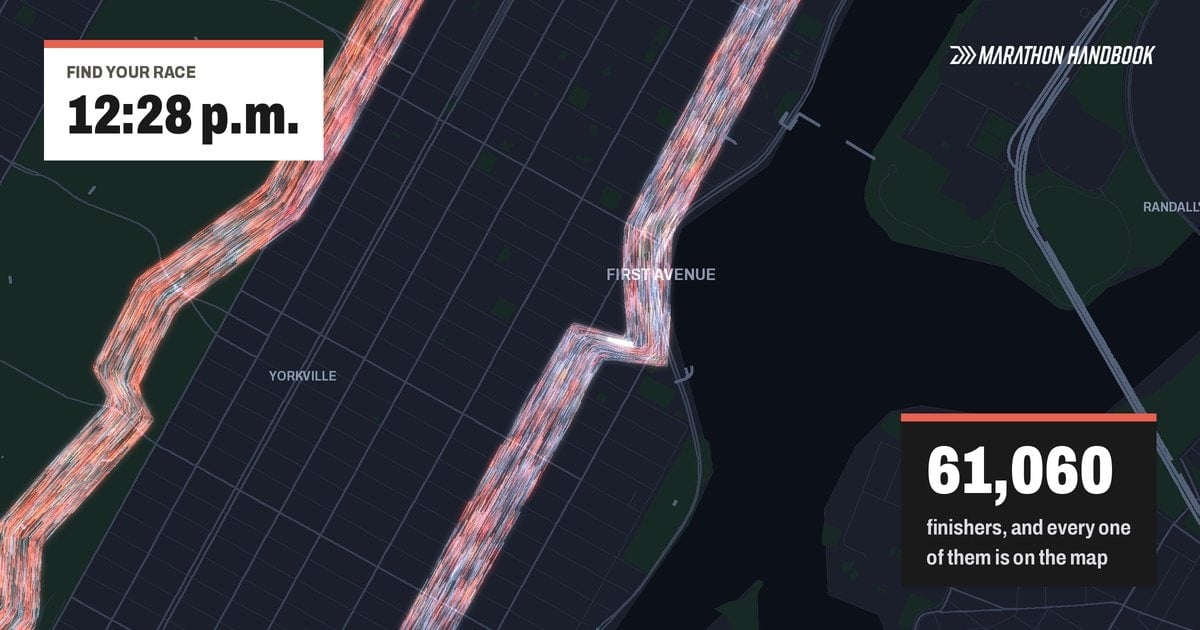
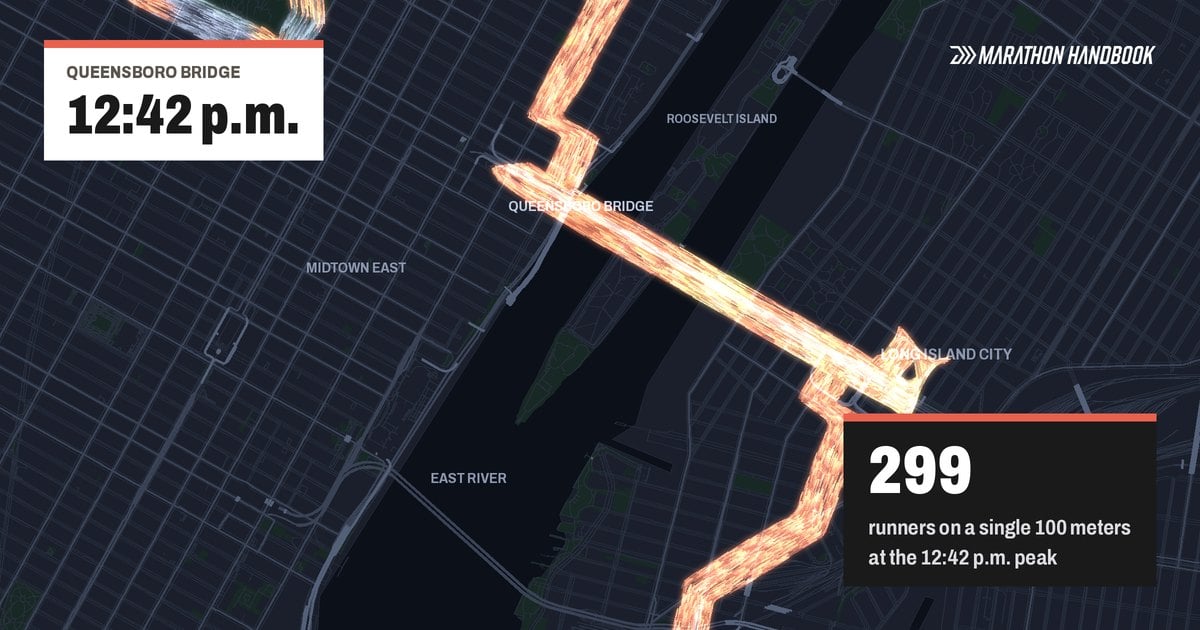
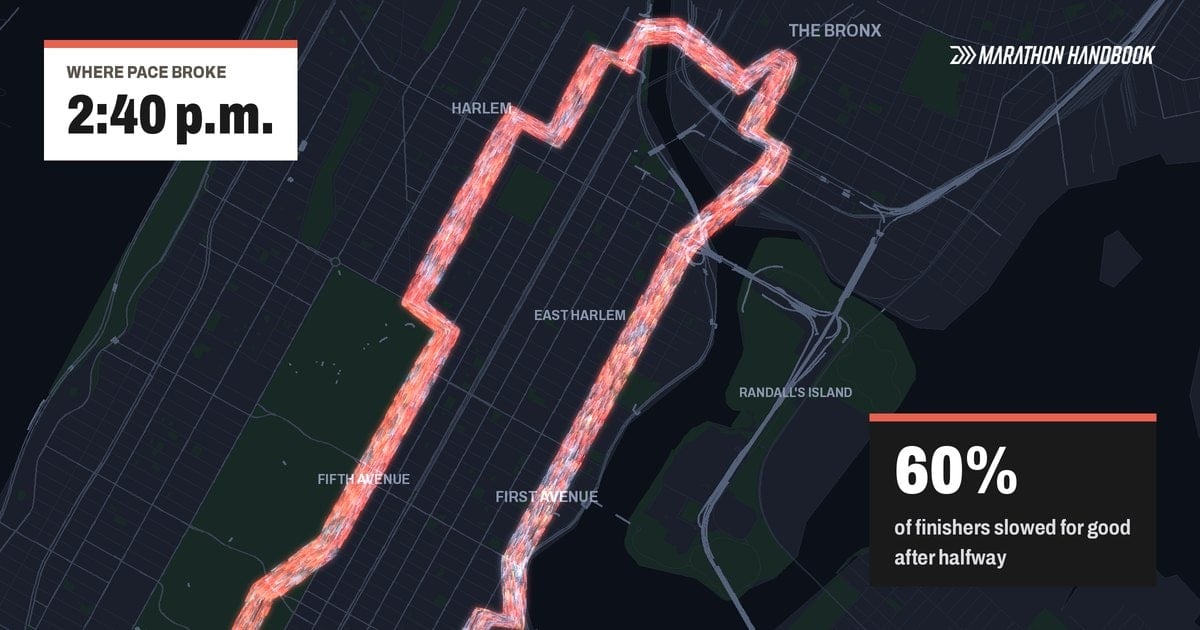
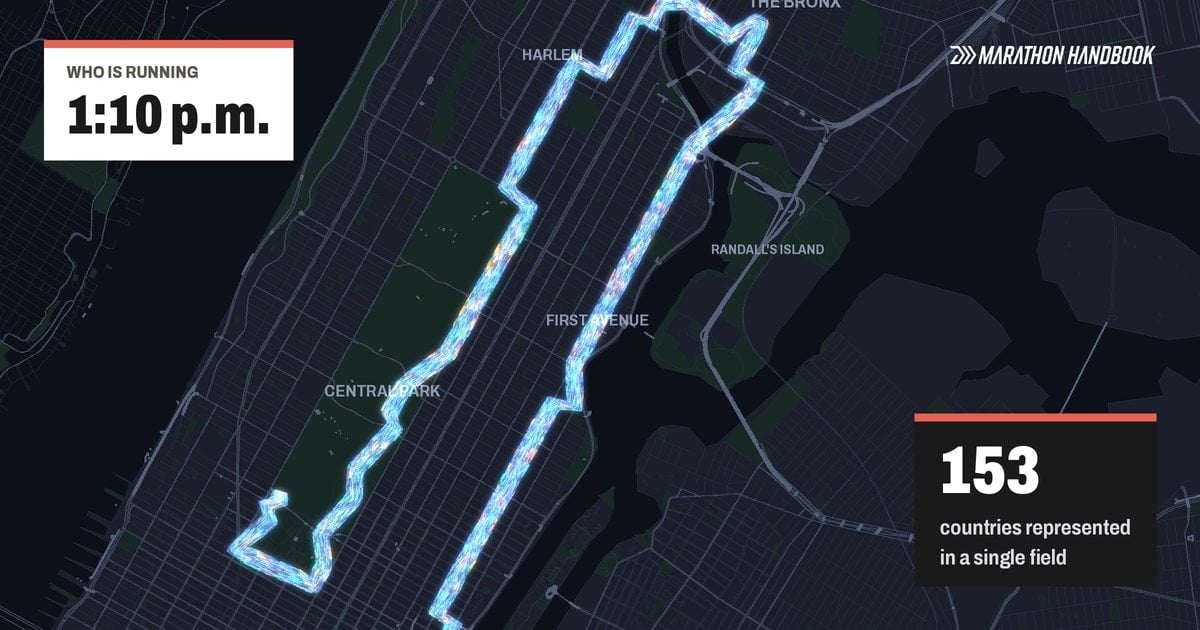
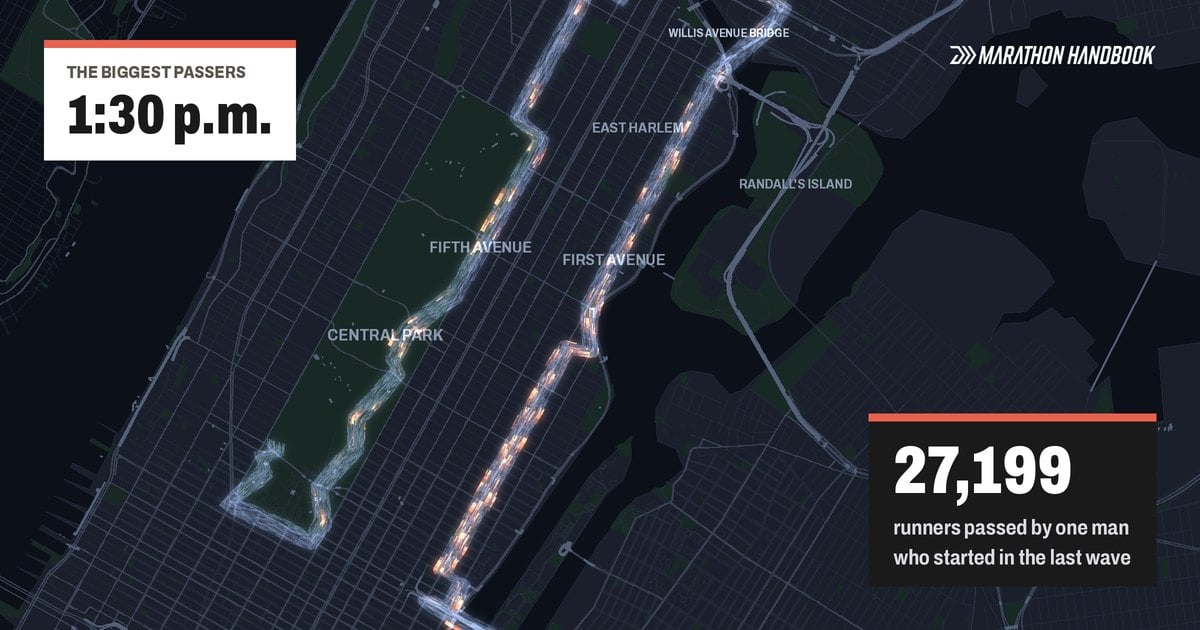
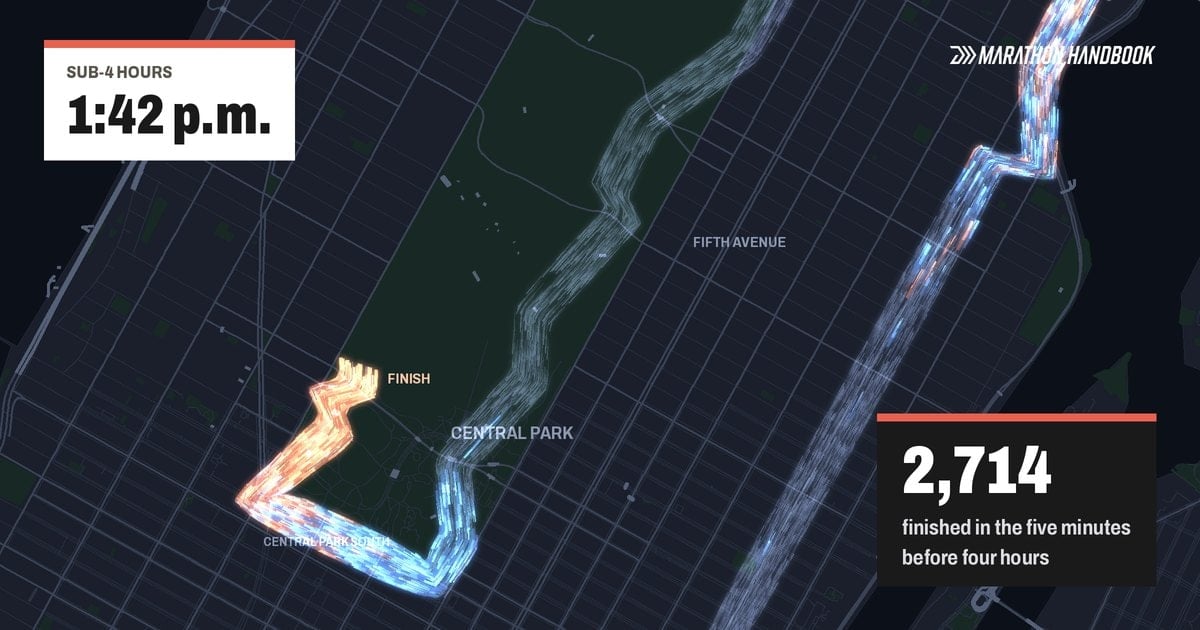
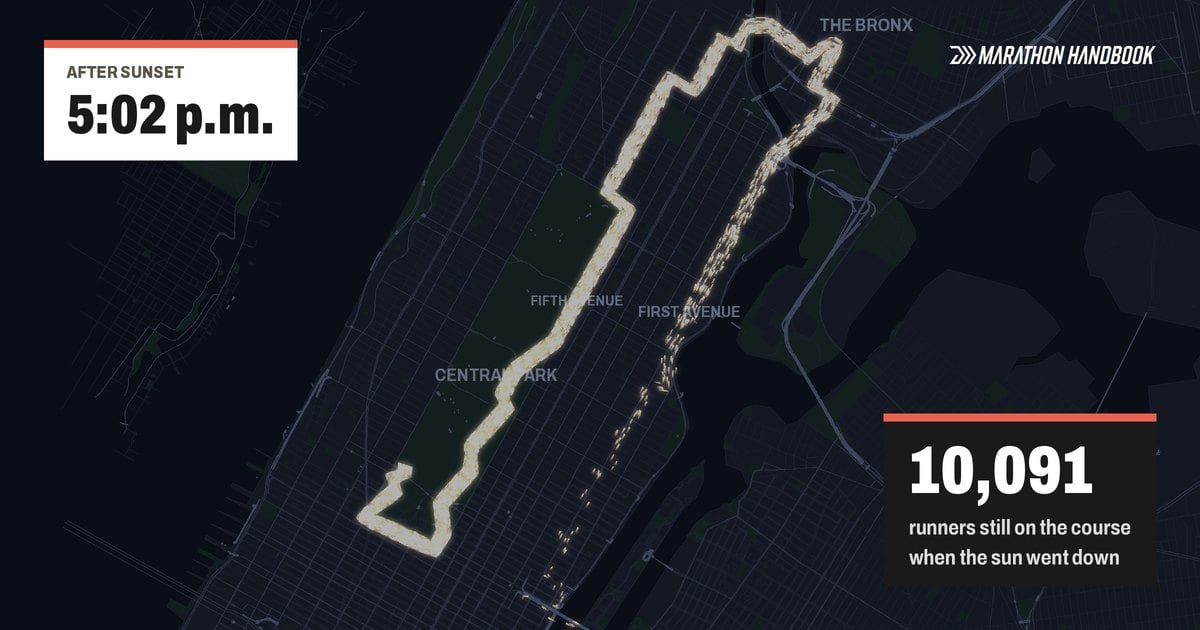
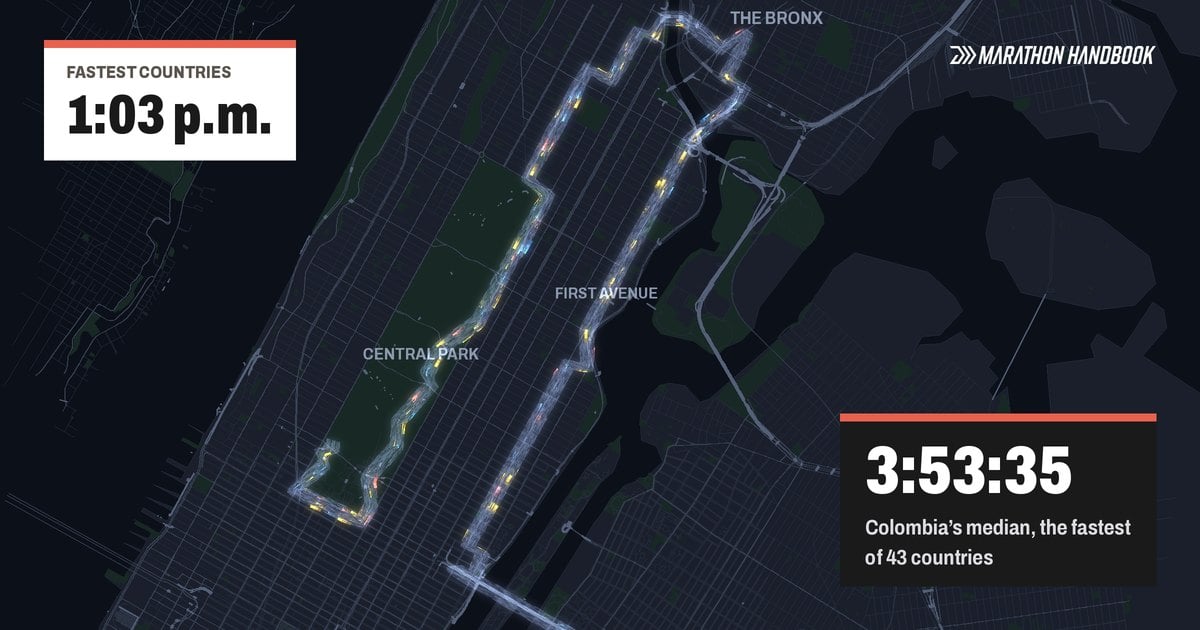
The map colors each runner by how far their current pace has fallen from their own first-half pace, with the temperature at that moment shown in the corner.
TEMPERATURE IN CENTRAL PARK
SECOND HALF SLOWER THAN FIRST, BY WAVE
Each row is a group of runners who reached halfway in the same five minutes. Darker cells slowed more. Blank cells have fewer than 50 runners.
RunClub
Get more running stories — join RunClub
Daily running news, a community of 300,000+ runners, free training plans for every distance, and a daily running game. Free to join — no card.
Already a member? Log in →


Start the conversation