


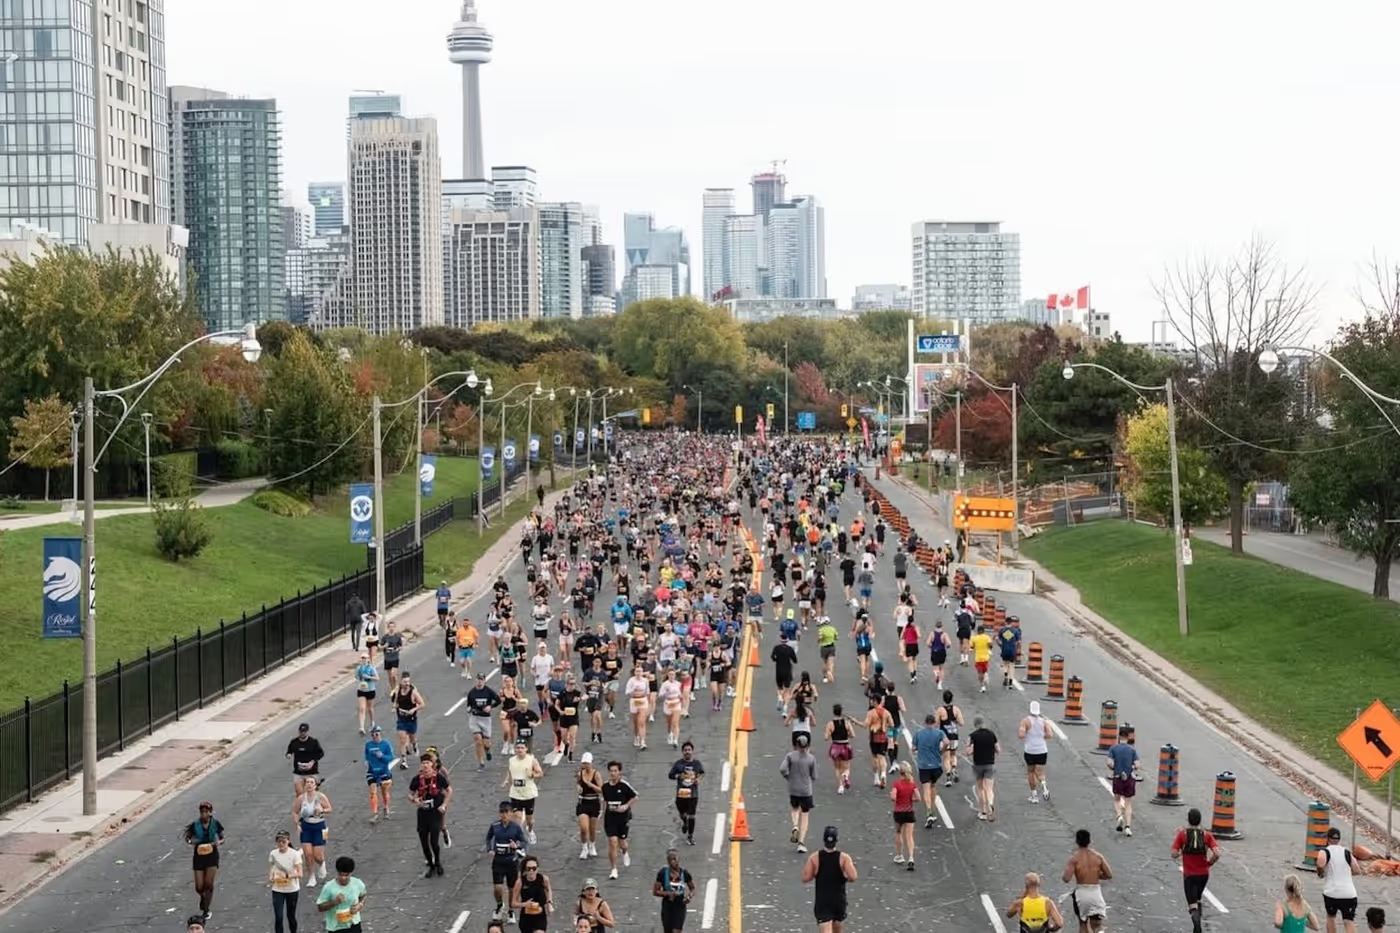
Toronto’s waterfront course is known as a fast one. Ed Whitlock ran several of his age-group world records here, and Cam Levins set a Canadian record on it in 2018. That reputation is deserved, but much of the race is shaped by the first seven kilometers and the last eight.
The course opens with a climb up Yonge Street and a long descent down Bathurst Street, which together can pull an even-paced plan out of shape. It then sends you out and back three times, twice along the open lakeshore, where a wind that helps you in one direction slows you in the other, and it finishes with a gentle climb up Bay Street.
Enter your goal finish time below, confirm your start corral, and either load the race-morning forecast or set the conditions yourself. The calculator builds a kilometer-by-kilometer plan from the splits of nearly 7,000 finishers of the 2025 race, the first held on the current course. It then adjusts each kilometer for the temperature and dew point at the hour you reach it, and for the direction of the wind relative to the road you are on. The chart can also be switched to miles.
The pace column is the effort to run, already adjusted for the course and the heat. The split column is the time your watch should show at each kilometer marker once the wind is accounted for. A tailwind along the lake means the same effort covers the kilometer a few seconds faster, and a headwind on the way back from the Beaches means it takes a few seconds longer, so hold the effort and accept the split that results.
The 2025 results point to one stretch in particular. For most finishers, the five kilometers after the Beaches turnaround were the slowest of the race, on an exposed road that often runs into a west wind, and the plan holds back a little energy for that section.
Downtown, around Bay and Front Streets, GPS watches lose accuracy among the tall buildings. On kilometers marked GPS, lap your watch at the official marker instead of relying on auto-lap.
Enter your goal, your corral and Sunday’s forecast.
Enter the time you would run on a cool, still day. The plan adjusts it for the conditions you set.
Start CorralCorrals are assigned by expected finish time, and the plan picks yours from your goal. Your start time sets the clock time you reach each kilometer, which determines how warm it will be when you get there.
Heat AdaptationRunners who trained through a hot summer lose less to warm conditions. The heat adjustment scales with this choice.
Toronto Waterfront Marathon Course Elevation Profile, Yonge Street to Bay Street
42.195 km / 26.2 miles from Yonge Street north of Gerrard to Bay Street at Queen. Almost all of the course’s relief comes in the first seven kilometers: about 20 meters of climbing up Yonge to Bloor, then a drop of roughly 35 meters down Bathurst to the lake. From there the course is close to level, with a short rise up Woodbine Avenue to Queen Street East and a gentle climb up Bay Street to the finish.
Your Toronto Waterfront Split Chart
| Your plan will appear here. |
Methodology
The pace targets in this Toronto Waterfront Marathon pace calculator come from a course-adjusted effort model built in two layers. First, we mapped the 2026 course from the race’s official interactive map: every turn, every turnaround, every aid station and every change in elevation from the start on Yonge Street to the finish on Bay Street. Second, we calibrated the model against the timing-mat splits of the full field of the 2025 TCS Toronto Waterfront Marathon, 6,899 finishers with clean splits. The 2025 race was the first run on the current layout; the 2026 start sits about 200 meters farther north, with the difference made up near Fort York. For each band of finishing times, we measured how fast runners covered each stretch between mats relative to their own average pace. The plan follows the runners in each band who slowed the least over the final 10K, blended with the field as a whole, so the targets describe a strategy Toronto finishers have actually executed rather than an idealized even split.
Within each stretch between mats, small adjustments account for the grade from the elevation profile and the three turnarounds. The splits always add up to your exact goal before weather is applied.
Weather is handled in two layers. Heat and humidity change the pace you can sustain at goal effort, so they adjust the pace column. The heat cost has two parts: one for air temperature above 55°F (13°C), and one for the sum of temperature and dew point in degrees Fahrenheit, a guideline widely used by coaches that starts to cost time once the combined figure passes 100 and climbs steeply past 150. Together they are calibrated to the slowdowns reported in studies of big-city marathon results (Ely et al., 2007; El Helou et al., 2012). The cost is scaled by finishing time, because slower runners spend longer in the heat and lose a larger share of their pace, and by the heat adaptation you select. Toronto’s corrals start between 8:00 and 9:20 a.m., and the morning warms as you run, so each kilometer uses the conditions for the hour you reach it.
Wind changes the clock rather than the effort, so it adjusts the split column. Each kilometer carries its compass bearings, traced from the official route, along with an exposure factor: the towers around Bay and Front Streets block much of the wind and the Don Valley shelters Bayview Avenue, while Lake Shore Boulevard takes all of it. The coefficients match our London and Chicago plans and draw on Pugh (1970), Kyle (1979) and Thompson (2015). A full headwind costs a 3:30 runner about 75 seconds over the whole race at 10 kph and about 240 seconds at 20 kph, tailwinds return 65 percent of the equivalent headwind cost, crosswinds count only above 15 kph, and wind effects after 30 km are amplified by 25 percent to reflect fatigue.
Live forecasts come from Open-Meteo‘s hourly model for downtown Toronto. The race-day forecast becomes available about two weeks before the race; until then, the button loads current conditions so you can experiment. Aid station and gel locations come from the race’s 2026 interactive map and may shift on race day. If you spot an error, tell us and we will fix it.
Data: 2025 TCS Toronto Waterfront Marathon results and splits via Sportstats. Course geometry, elevation and aid stations from the race’s official interactive course map. Analysis by the Marathon Handbook data team.
For the professional race, read our preview of the elite field.
RunClub
Get more running stories — join RunClub
Daily running news, a community of 300,000+ runners, free training plans for every distance, and a daily running game. Free to join — no card.
Already a member? Log in →



Start the conversation