


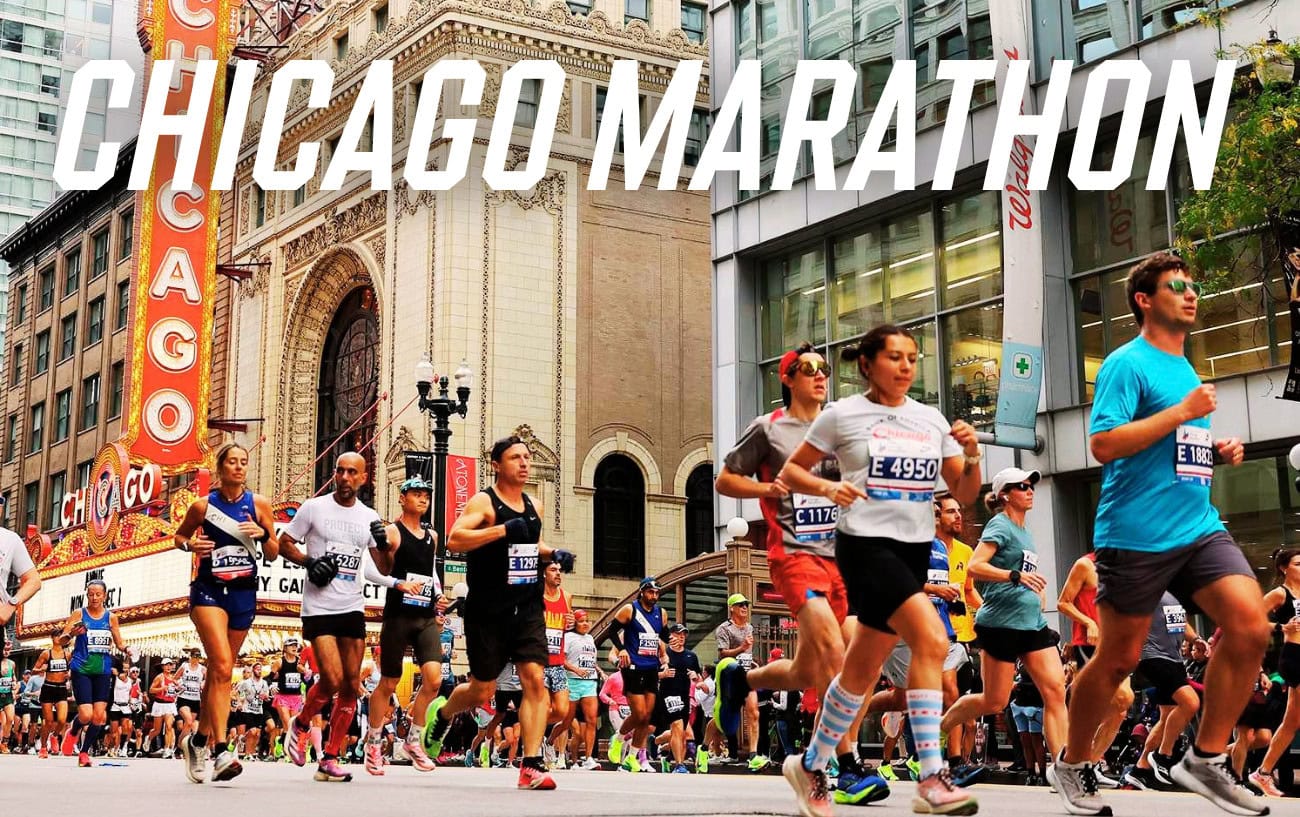
Chicago has a reputation as the flattest and fastest of the World Marathon Majors, and the reputation is mostly earned. What it hides is that the course asks for a different kind of discipline than a hilly race does. There is no single climb to plan around; there are five river crossings, more than 35 turns, long stretches between skyscrapers that confuse your watch, a lakefront that can give you a tailwind on the way north and take it back on the way south, and a morning that keeps warming the longer you are out on the course.
Enter your goal finish time below, choose your start wave, and load the race-morning forecast for Grant Park or dial in your own conditions. The calculator builds a mile-by-mile and kilometer-by-kilometer plan from the 5K split patterns of thousands of Chicago finishers across the last four editions, then adjusts every mile for the temperature and dew point you will meet at that hour and the direction the wind is blowing relative to the street you are on.
The pace column is the effort you should run, already adjusted for the course and the heat. The split column is what your watch should read at each official mile marker once the wind has done its work. A tailwind on Michigan Avenue means the same effort arrives a few seconds sooner, and a headwind on Wells Street means it takes a few seconds longer, so run the effort and let the clock show what it shows.
One warning specific to Chicago: in the Loop, GPS watches routinely drift by a tenth of a mile or more. Miles marked GPS in the plan are the ones where you should lap your watch at the official mile marker rather than trusting the auto-lap.
Enter your goal, your wave and Sunday’s forecast.
Enter the time you would run on a cool, still day. The plan adjusts it for the conditions you set.
Start WaveYour wave sets the clock time you reach each mile, which determines how warm it will be when you get there.
Heat AdaptationRunners who trained through a hot summer lose less to warm conditions. The heat adjustment scales with this choice.
Chicago Marathon Course Elevation Profile, Grant Park to Grant Park
42.195 km / 26.2 miles on a loop that starts and finishes on Columbus Drive. Between those two points the city is close to level. The changes you will feel come at the start, as you climb out from under Lower Columbus Drive, at the short ramps onto five river bridges, and in the final half mile, where Roosevelt Road rises over the rail tracks before the finish.
Your Chicago Marathon Split Chart
| Mile | Km | Zone | On course | Pace /mi | Pace /km | Split | Cumulative | Landmark · History · Race craft |
|---|---|---|---|---|---|---|---|---|
| Your plan will appear here. | ||||||||
Methodology
The per-mile pace targets in this Chicago Marathon pace calculator come from a course-adjusted effort model built in two layers. First, we mapped the course street by street: every turn, every river crossing and every change in elevation from the start on Columbus Drive to the finish in Grant Park. Second, we calibrated the model against the 5K split times of thousands of Bank of America Chicago Marathon finishers from 2022 through 2025, drawn evenly from every finishing time, men and women alike. For each band of finishing times, we measured how fast runners covered every 5K segment relative to their own average pace. The plan follows the runners in each band who slowed the least over the final 10K, blended with the field as a whole, so the targets describe a strategy Chicago finishers have actually executed rather than an idealized even split.
Within each 5K block, small terrain adjustments account for the opening turns out of Lower Columbus Drive, the corners through Old Town and Chinatown, and the Roosevelt Road bridge. The splits always add up to your exact goal before weather is applied.
Weather is handled in two layers. Heat and humidity change the pace you can sustain at goal effort, so they adjust the pace column. The heat cost has two parts: one for air temperature above 55°F, and one for the sum of temperature and dew point in degrees Fahrenheit, a guideline widely used by coaches that starts to cost time once the combined figure passes 100 and climbs steeply past 150. Together they are calibrated to the slowdowns reported in studies of big-city marathon results (Ely et al., 2007; El Helou et al., 2012). The cost is scaled by finishing time, because slower runners spend longer in the heat and lose a larger share of their pace, and by the heat adaptation you select. Chicago’s three waves start between 7:30 and 8:35 a.m., and the morning keeps warming as you run, so each mile uses the conditions for the hour you reach it.
Wind changes the clock rather than the effort, so it adjusts the split column. Each mile carries its compass bearings, which on Chicago’s street grid are almost always due north, south, east or west, along with an exposure factor: the towers of the Loop block much of the wind, while Lincoln Park and the lakefront take all of it. The coefficients match our London plan and draw on Pugh (1970), Kyle (1979) and Thompson (2015). A full headwind costs a 3:30 runner about 75 seconds over the whole race at 10 kph and about 240 seconds at 20 kph, tailwinds return 65 percent of the equivalent headwind cost, crosswinds count only above 15 kph, and wind effects in the final eight miles are amplified by 25 percent to reflect fatigue.
Live forecasts come from Open-Meteo‘s hourly model for Grant Park. The race-day forecast becomes available about two weeks before the race; until then, the button loads current conditions so you can experiment. Course geometry was traced from the official street closure list and checked against official timing points, and the elevation profile is a smoothed street-level estimate. Historical notes draw on the Encyclopedia of Chicago, the City of Chicago’s landmark designations, the Chicago Architecture Center and the Chicago Marathon’s official course materials. If you spot an error, tell us and we will fix it.
Data: Bank of America Chicago Marathon official results, 2022 to 2025, sampled across every finishing time. Course geometry and water features from OpenStreetMap contributors. Analysis by the Marathon Handbook data team.
RunClub
Get more running stories — join RunClub
Daily running news, a community of 300,000+ runners, free training plans for every distance, and a daily running game. Free to join — no card.
Already a member? Log in →



Start the conversation