

Fastest Marathons By Event And Theirtrends—Men
Every year, big-city marathons such as New York, Boston, London, and Berlin are won in fast times. For example, four men’s world records have been set in Berlin in the last 10 years. However, that marathon has not always attracted the very top runners; the male winner clocked 2:47:08 in 1975. The winning times from year to year can be used to determine which marathons are consistently won in the fastest times. This study will do just that and go further to reveal how fast or slow the major marathons of the world have been won in throughout the last three decades. The women’s version of this study will be featured in a later edition of M&B.
The graphs on the following pages contain plots for marathons particular to a continent. For example, the North American East Coast & Midwest Marathons sheet includes plots for New York, Chicago, Boston, and six other large marathons. Each plot is a line through time representing an ongoing six-year average based on the winning times. For example, the Boston Marathon’s men’s six-year average for the year 2011 is the addition of the winners’ times for 2006 + 2007 + 2008 + 2009 + 2010 + 2011, all divided by six. That is the six years leading up to and including 2011, and the following details the calculation:
The ongoing average for 2012 is 12:46:49 minus Robert Cheruiyot Kipkoech’s 2:07:14 of 2006 plus Wesley Korir’s 2:12:40 winning time for 2012, making 12:52:15 divided by six, which is 2:08:42 1/2. So every year a rolling six-year average is determined.
A six-year average is found because that is suitable for a trend to be seen. If the winning time each year were used, the resulting plots are likely to be some-
Boston Marathon six-year average for the year 2011 1
2
3
4
5
6
2006
2007
2008
2009
2010
2011
2:07:14
2:14:13
2:07:46
2:08:42
2:05:52
2:03:02
Robert Cheruiyot Kipkoech
Robert Cheruiyot Kipkoech
Robert Cheruiyot Kipkoech
Deribe Mergia Ejigu
Robert Cheruiyot Kiprono
Geoffrey Mutai Kiprono
Kenya
Kenya
Kenya
Ethiopia
Kenya
Kenya
12:46:49 total time for six marathons / 6 years = 2:07:48 ongoing average for 2011
what haphazard trying to account for anomalies. In the example of the Boston Marathon, the winning time in 2007 is very slow and 2011 very fast. These two anomalies cancel each other out. If too many years are used, the plot is overly smoothed and the trends unresponsive or even lost. That is, it takes too long for the plot to respond to what is actually happening in reality. A six-year average incorporates a few years of lag, be that where there are sudden changes in performance, although for our purposes six years is suitable to reveal the greater picture, which is what we are looking for.
For an event to be won in a consistently fast time, the weather, the nature of the course, the attractiveness of the event, and so forth must always be good. That, as we will find out, is not always the case even for a major marathon where fast times usually come with big financial rewards. However, the money offered, the prestige, and the size of a marathon usually dictate the level of competition running and so the quality of the winner’s time. That is regardless of the course profile until there is a very good elite field and conditions also have a say. We will not focus on the names that keep winning marathons but will look at the trends by event in terms of just time. In doing so, we can race marathons against each other, seeing which ones are won in the fastest times and when.
In the March/April 2009 edition of M&B, we looked at the men’s world and national yearly marathon best-time trends. Analysis by event ought to parallel that according to the overall trends of each country. We will identify any exceptions; after all, countries like America are vast enough to accommodate different marathon trends.
We will look at the fastest won marathons by country and by continent. Countries and continents have national and international championships. These tend to shift locations, and our analysis does not include such races unless they are held each year in the same place. So the Olympics and World Championships do not feature here. We will finish by amalgamating the plots for the best marathons on each continent so that the marathon power of each continent can be put in
perspective of the others as well as seeing which race was consistently the fastest in the world for any given date in the modern era. On page 73 is a medal table by country based on the best six-year average for more than 300 marathons.
North American East Coast and Midwest The first graph shows the main marathons on the East Coast and Midwest of America. The plots indicate the marathon was still being developed in those regions in the early 1980s. The plots for each marathon rise and by the mid-1980s reach a plateau. Most decline during the 1990s and rise in the 2000s, surpassing the 1980s high. That mimics the national trend. Only New York and Boston held up during the slump, probably due to their prestige. Chicago was not always held as the dashed line denotes but became one of the fastest marathons (again) at the turn of the millennium. Chicago has a very flat course but the weather can be too hot or cold; such is the diurnal range of continental weather in the fall. The plots for Boston and New York imply that their hills and the average effect of the wind slows runners because top elite runners like to compete in these marathons.
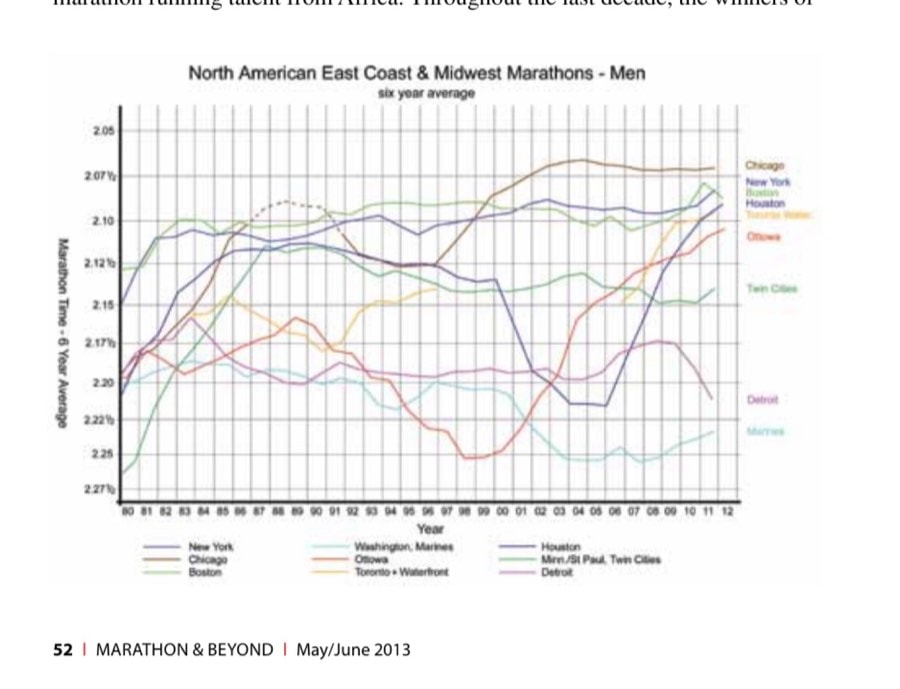
Houston, Toronto Waterfront, and Ottawa have recently enjoyed significant improvements in their winning times. In the future, they may even surpass New York and Boston, with Houston the most likely to do so. The improving winning times of lesser-known marathons is indicative of an increase in the pool of marathon running talent from Africa. Throughout the last decade, the winners of
American and European city marathons tend to be Kenyans and Ethiopians. There are so many fast African runners that if more compete outside of their homeland, the trend for faster winning times will be exaggerated. That is almost guaranteed for all marathons with a decent prize-winning purse. The winner no longer comes from the indigenous population.
Not all city marathons have recovered from the marathon slump (after the original boom). Detroit and Washington Marine Corps are the best examples. The latter is particularly a “people’s” marathon, where the emphasis is on participation rather than on winning. Such marathons are geared more to supporting charities than to giving large windfalls to winners. Incidentally, Doug Kurtis won the Detroit Marathon six times in a row, the only man I found to have the complete set (of six) in this study. Doug made the Detroit average 2:18:53 in 1992 (record average is 2:16:01 in 1983) and holds the world record for the most marathons run under 2:20 with 76. The winning times for many of the large city marathons in the United States have gotten much slower. Philadelphia, Columbus (Ohio), Miami, New Orleans, Austin, and Huntsville Rocket City all had winners regularly breaking 2:20:00 during the boom years. Atlanta averaged 2:20:07 in 1979 but fell away to 2 hours, 37 minutes for the average in 2010 and lost its full-marathon status the following year. Other marathons have stabilized or improved, including Cleveland, Dallas White Rock, San Antonio, Nashville Country Music, Memphis St. Jude, and Baltimore—the last having an average of 2:14:33 in 2011.
The Fastest Marathons List starting on page 63 includes (almost) every marathon with a six-year average of under 2:20:00. The times in brackets refer to an altitude-adjusted value. For example, Duluth Grandma’s Marathon would be a minute and a half faster if the altitude was at sea level. Duluth is not a large city but has a relatively fast average for its size, 1985 being the peak year with 2:12:08. That marathon’s history appears to have the same trend as Twin Cities, which has a slight decline. Just north of the border into Canada, Winnipeg also does well for its size, but its winning times have significantly declined and Montreal is not what it used to be, unlike Ottawa’s renaissance. So a region can simultaneously experience both a marathon boom and a bust in its winning times.
North American West Coast and Rockies The winner’s times in marathons on America’s West Coast and Rockies are slower than those in the rest of the country(ies). That is probably due to a smaller population and also to hotter weather for most of the region, even during the marathon seasons. The altitude of the Rockies is another detrimental factor. San Diego is the fastest, and that is part of the Rock ’n’ Roll series of marathons. There are dozens of these “music” marathons across North America and also some in Europe. The Rock ’n’ Roll format is relatively new, and the one at Phoenix attracted
particularly fast runners until 2011. The marathons at Los Angeles combine to ensure that the city has a long marathon history. The dates in the fastest-marathon list have some West Coast marathons whose best averages go back to the 1970s, and women’s world records were set at Culver City and Eugene. Even local marathons such as the Trail’s End Marathon in Seaside, Oregon, averaged under 2 hours, 20 minutes. The graph includes Napa Valley and the Avenue of the Giants Marathons to highlight the decline in relatively local marathon standards. Clearly, what was once the marathon hot spot of the US West Coast has long since passed the baton to the East of the country (or west to Japan). The big-city marathons of San Francisco and Portland have also had many years in decline. Seattle, Vancouver, Carlsbad, Long Beach, and Denver are likewise, Denver’s long-defunct Mile High Marathon (as opposed to the new Rock ’n’ Roll) not even breaking 2:25 for a six-year average. Seattle’s Emerald City Marathon is particularly slow given the size of the population and the cool conditions. One city marathon that has done well is Honolulu, although recently it is losing ground. That plot is more in keeping with the Japanese trend shown later.
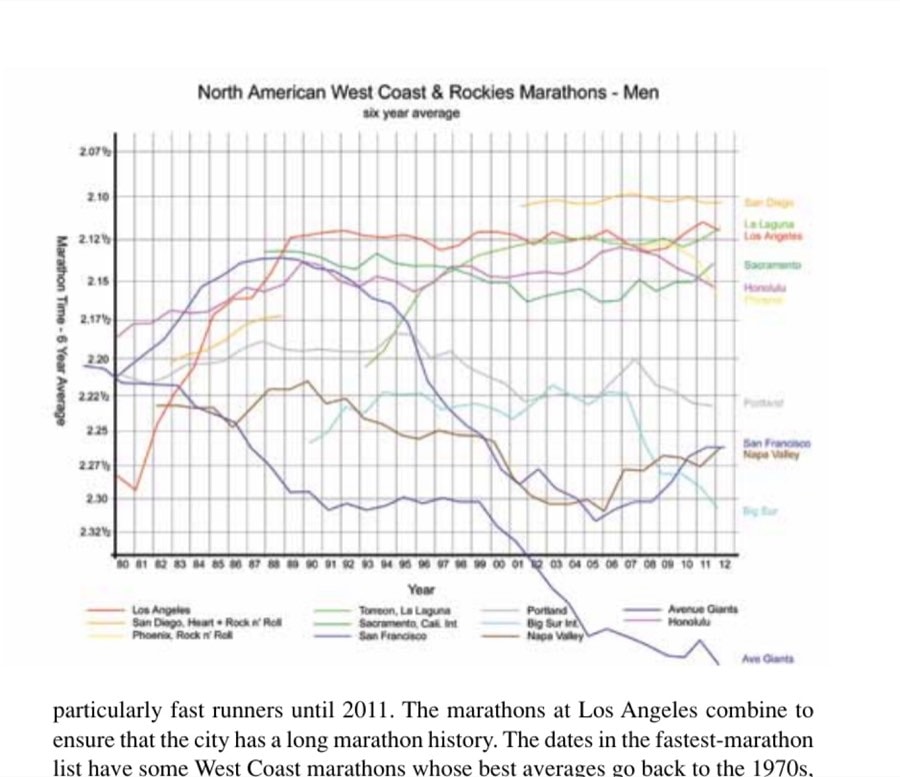
Some marathons are labeled “international,” which implies “big” and “global.” Based on the winning times, Sacramento is worthy of that title even though the course is downhill. Big Sur is more national than its boast, but the least-international international is probably Connemara in Ireland, albeit the sponsor is international
with former international Ron Hill (former marathon world record holder and sports-shop entrepreneur) supporting the event. Defying the altitude, the Rockies have some small marathons that have made the fastest-marathons list. St. George and two events in Salt Lake City are listed. The greatest triumphs at altitude in the Americas are in Mexico. Torreon’s La Laguna Marathon is plotted and appears to have reached maturity at 2:12 ½ (2:08 accounting for the altitude). The Mexico City Marathon is one of fastest accounting for altitude and is being won in slightly faster times each year. Guadalajara is not far behind with San Luis Potosi, Leon, and Monterrey also on the list. Central America by way of the Caribbean has one entry on the list.
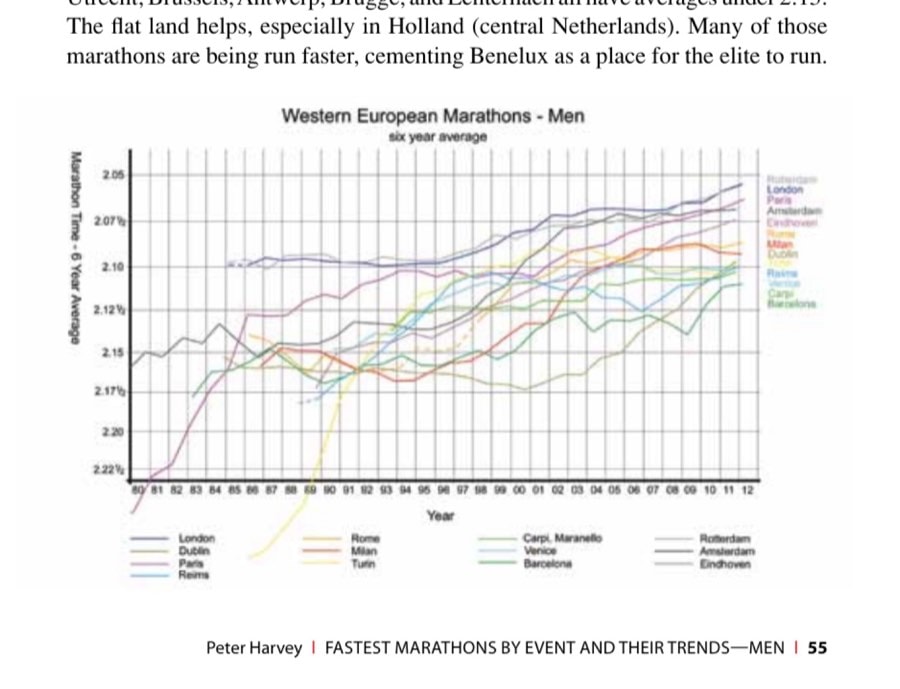
Western Europe From the mid-1980s, Western Europe has been packed full of marathons finished in very fast times. All but one plot, Milan, is in ascendancy. The improvement contrasts with the national trend for Europe, which is currently in decline. Europeans are not winning their own marathons.
Rotterdam and London share top honors with Amsterdam, and Paris is not far behind. The two Dams aside, the Netherlands also has Eindhoven, whose average is exceptionally fast inasmuch as that city could pass for a large town. Within Benelux (Belgium, the Netherlands, and Luxembourg), Enschede, Maassluis, Utrecht, Brussels, Antwerp, Brugge, and Echternach all have averages under 2:15. The flat land helps, especially in Holland (central Netherlands). Many of those marathons are being run faster, cementing Benelux as a place for the elite to run.
Great Britain has one of the greatest marathons traditions, but there is little to back that up today. Britain was once at the forefront of marathon running with many high-quality marathons during the 1970s and 1980s, especially in the Midlands and north of the island. The Manchester Marathon averaged 2:13:04 for five races to 1973, and the Polytechnic (like a university but more practical) Marathon at Windsor was 2:15:38 in 1971. The decade before the original marathon boom, Great Britain was the place to be for the best competition. Great Britain and Ireland includes the Dublin Marathon that has found maturity, averaging just under 2:10:00. Every marathon that has or had a six-year average below 2:10:00 is included on the graph (regardless of continent), and significant others are also included. Also in Ireland is Belfast, and that is minutes slower.
France has a marathon tradition. Lyon, La Rochelle, Mont-St-Michel, Lille, Monte Carlo, and Puteaux, the last in Paris, have all been under 2:15:00 with a few still won at that standard. Every and Neuf Brisach rivaled Britain’s marathons in the early 1980s. Some French marathons are experiencing faster winning times, and the marathon at Reims just dipped under 2:10:00 in 2011, satisfying criteria to be plotted. The new Alps Maritimes Marathon on the Cote d’Azur may also be that fast in the next year or three.
The Barcelona Marathon has been plotted, and like other Iberian events, there are no really fast times posted with no averages faster than 2:10:00. San Sebastian has a slightly faster average than Barcelona and so has Madrid were the altitudeadjusted value to be the benchmark. Seville, Valencia, Lisbon, and Porto also ensure that Iberia has a variety of sub-2:15:00 marathons.
Further into the Mediterranean is Italy. Like Spain and Portugal, Italy took time to develop its marathons but has subsequently become a center for excellence. The plotted marathons of Rome, Milan, Turin, Venice, and Carpi aside, Padova, Brescia, Florence, Trieste, and almost Treviso average sub-2:12:00—and recently, too. Italy matches the number of marathons in the USA under a 2:12:00 average, which is pretty amazing considering the difference in population between the two countries. The Po Valley in the north of Italy hosts many fine races. The Italians are passionate about their marathons, and the strength in depth to the winning times is particularly good.
Central, Northern, and Eastern Europe The plot that eclipses all others on the Central, Northern, and Eastern European graph is Berlin’s. The recent world record of 2:03:38 was run there and helps get the six-year average below 2:05:00, more than a minute faster than any other race. Germany has two other marathons that are consistently run faster than 2:10:00, Hamburg and Frankfurt. Cologne, Dusseldorf, Hannover, and Mainz are all sub2:13:00, and there are many more high-quality races, most of which are recently
experiencing record finishing times. Germany is a marathon powerhouse, having almost 400 events in 2010, only 40 percent fewer than the United States, which has four times as many people. In that respect, the USA has scope for much more marathon growth.
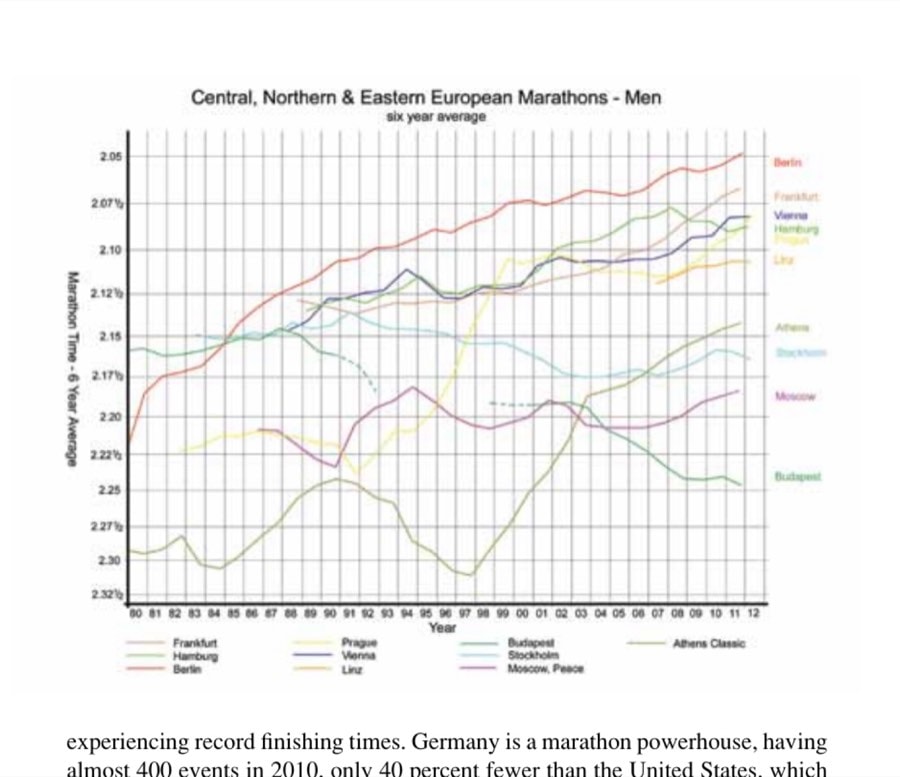
Not all of Europe’s marathons are on an upward trend. Stockholm’s plot is typical of the decline in Scandinavia (Norway, Sweden, Finland, and Denmark plus Iceland). Denmark has the most marathons, and given its flat land there is possible potential for its city marathons to greatly improve, paralleling the Netherlands. In Hungary, the once-fastest marathon almost in the whole of Europe, Budapest, is in the doldrums, likewise Bucharest in Romania, although that marathon has been recently restarted. Moscow has a very low standard given the size and magnitude of the city. The Siberian International at Omsk (plotted on a different graph), White Nights of St. Petersburg, and Uzhgorod marathons, the latter in Ukraine, are both higher up the fastest-marathons list. The large city of Kiev does not make the list. Since the disintegration of the USSR and the lowering of the Iron Curtain, parts of Eastern Europe have significantly developed. The Czech Republic, Slovakia, Poland, and most of the Balkans are examples. Their marathons are getting faster, especially Prague, which moved up to number 15 on the marathon list. Kosice in Slovakia is a few minutes behind and has always
been a high-quality race. Poland has many marathons on the list, and nearly all of the fastest ones are in ascendancy. Poland is like Spain and Portugal in that they have no marathons that average under 2:10:00. Warsaw, Poznan, Krakow, and the age-old marathon at Debno have the fastest winners. In the Balkans, the top marathons in Slovenia and Serbia show the most potential, and farther south the Athens Classic Marathon in Greece is in revival. The alpine countries of Austria and Switzerland are doing well, especially Vienna. The relatively new marathons of Linz plus Zurich and Lausanne are also being won in ever-faster times.
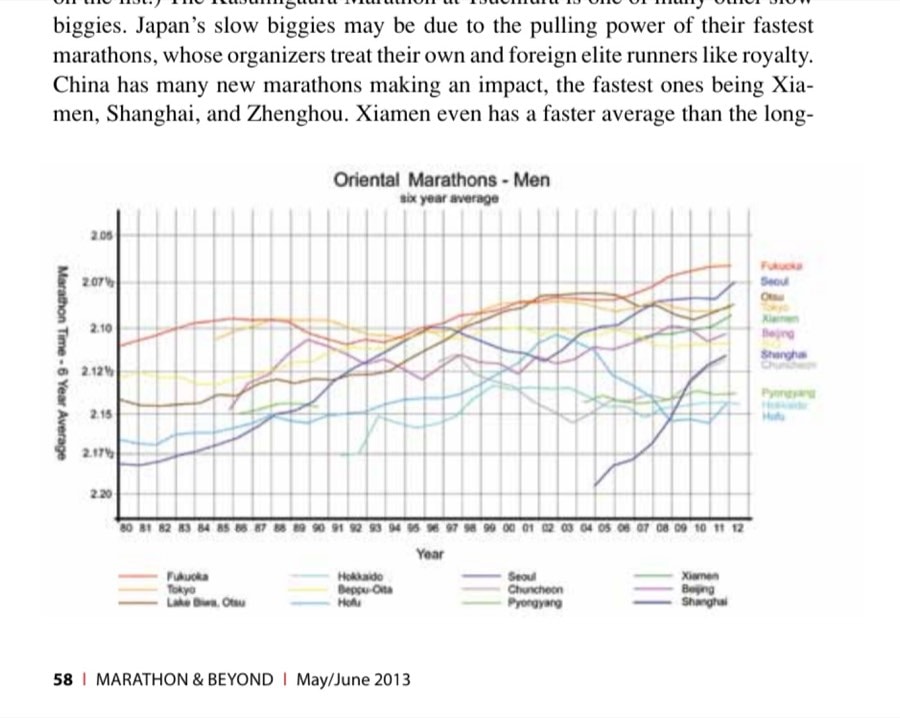
The Orient The Orient is led by Japan, in particular the Otsu, Beppu-Oita, Tokyo, and Fukuoka marathons. Several decades ago, Fukuoka was the unofficial world championship and has had a couple of men’s world records set there. With the exception of Fukuoka, most other top Japanese marathons are not being run faster. Hofu has lost its status as one of Japan’s best marathons; however, Nagano, Nobeoka, and Sapporo are all quicker today. Japan has the oldest entry on the fastest-marathons list, with Toyohashi averaging 2:19:03 in 1969. Japan also has the largest marathon (11th by size in 2010) that does not make the sub-2:20:00 list: Naha, with close to 20,000 finishers. (Orlando’s Disney World Marathon was next and is also not on the list.) The Kasumigaura Marathon at Tsuchiura is one of many other slow biggies. Japan’s slow biggies may be due to the pulling power of their fastest marathons, whose organizers treat their own and foreign elite runners like royalty. China has many new marathons making an impact, the fastest ones being Xiamen, Shanghai, and Zhenghou. Xiamen even has a faster average than the long-
standing Beijing Marathon. South Korea also has an upward trend, with Seoul and the recently started Daegu Marathon being the two fastest. North Korea is more erratic, with Pyongyang, Chuncheon, and Gyeongju not quite in the class of their southern neighbor.
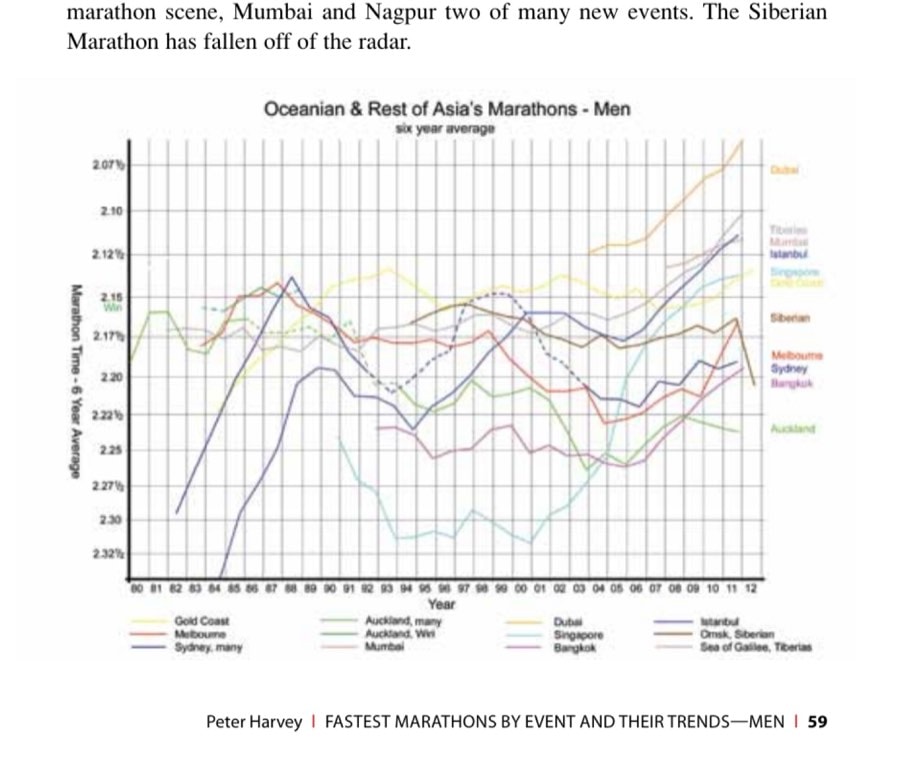
Oceania and the rest of Asia Until recently, the rest of Asia has been somewhat bereft of marathons, let alone any being won in a fast time. Dubai stands out, and there was a quarter of a million dollars each for the male and female winners in 2012. Recently, that plot rose to 2:05:30 in 2013 (not updated on the graph), challenging the very fastest marathons in Europe and making second on the list. Only Berlin is faster. London and Rotterdam, both held during April in 2013, are likely to recapture second and third place, respectively. The Middle East has a couple of other fast marathons by way of the Sea of Galilee in Israel and Istanbul in Turkey. However, for its population, the Arab world has a lack of fast marathons, but then the climate is conducive to racing only in the winter. The Singapore and Bangkok marathons of Southeast Asia are rapidly improving. That area is not known for its own marathoners, and the same is so for India. India is the most recent entrant on the marathon scene, Mumbai and Nagpur two of many new events. The Siberian Marathon has fallen off of the radar.
In the 1970s, New Zealand had some of the fastest marathons in the world. By the 1990s, its marathons were in decline, the once-great marathons of Auckland nowhere near breaking 2:20:00 today. In fact, there is only one entry in the fastest-marathons list for New Zealand/Australia with a date in the last dozen years. However, the big-city marathons of Sydney and Melbourne have recently improved but are yet to overtake their mid-1980s high points. Only the Gold Coast Marathon at Brisbane has maintained a constant winner’s standard (around 2:15:00).
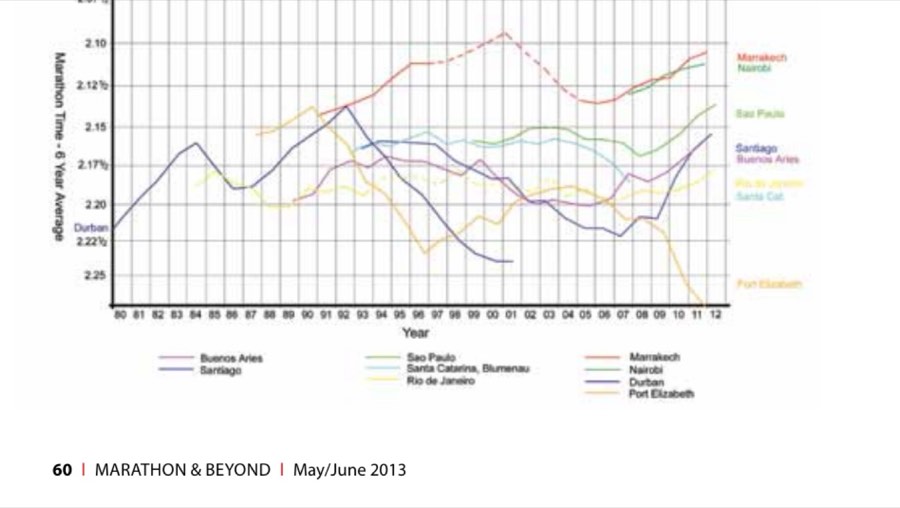
South America and Africa South America has not attracted the best marathoners. There are and have been some top runners, especially from Brazil, but its marathons are rarely run faster than 2:15:00. Sao Paulo, Rio de Janeiro, Santiago, and Buenos Aires all show recent improvement, and this is mainly down to the odd victory by an African. The African marathon trends are split between South Africa and East/North Africa. The South African marathons at Durban, Cape Town, and Port Elizabeth were strong in the 1980s and 1990s. The Marrakech Marathon in Morocco has a couple of decades of being the fastest African marathon. Nairobi has become one of the fastest African marathons, which, considering its altitude (5,450 feet), is amazing, the performances as good as the best big-city marathons. Kenya has other marathons at altitude on the list and given the abundance of local talent could fill many a new event. Considering the number of runners in Africa and the standards of excellence, there is tremendous scope for many new marathons and
for them to be run in fast times, especially if at sea level. There has been investment in Casablanca, Morocco, and the average is heading toward sub-2:10:00. In addition to Kenya, there are also marathons at altitude in Tanzania, Ethiopia, and Rwanda on the list.
Continental bests The graph showing the continental bests represents an amalgamation of the fastest marathons for each continent. For example, the North American plot starts with Boston in 1980, then uses New York in 1981, and back to Boston until 1999, when Chicago takes over. The North American plot was the highest in the world for eight of the last 20 years but has recently remained on a 2:07¼ plateau while all the other continental plots have made progress. A problem with North America’s fastest marathons is that they are not ideally suited to facilitate the very fastest times anymore. That is because of hills, head winds, climate, or slight altitude. In years gone by, these handicaps could be tolerated because not many men could get within a minute or two of the world record. Today flat, fast courses at sea level in ideal conditions like those in Western Europe are arguably the only ones suitable to break world records. America has suitable courses, but they are in lesser-known city marathons with little financial reward.
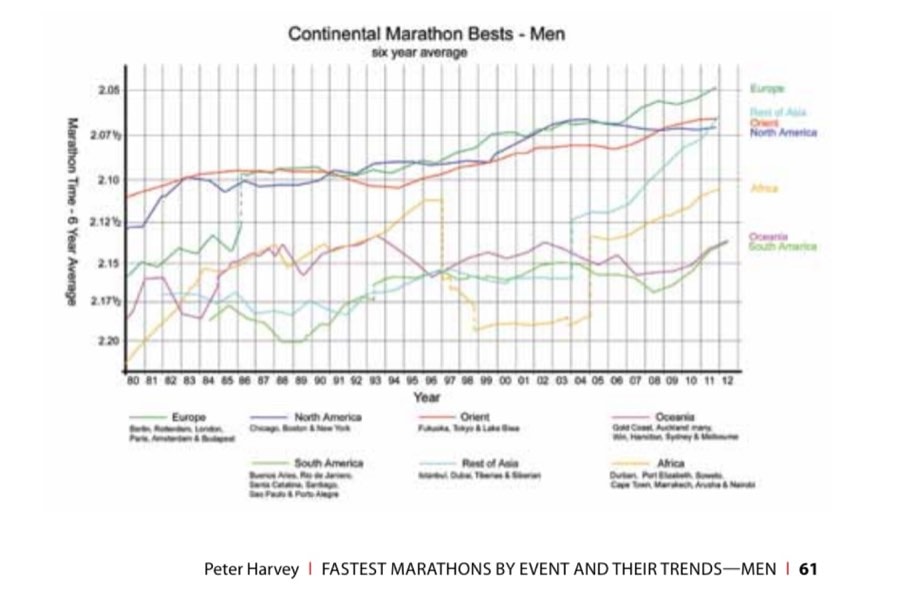
When the marathon boom matured in Europe during the mid-1980s, the times there ensured that the North American and Oriental plots were matched. The Orient has always been a major player but it has just been surpassed by the rest
of Asia because of Dubai. The Oceanian and South American plots show that there has never been a top-class marathon run regularly. They indicate that the Northern Hemisphere is where most of the action is. Africa is showing potential after a rocky phase in the late 1990s and early 2000s by recently surpassing its mid-1990s peak.
The continental graph indirectly shows which marathons were the fastest for any given year. The other graphs need to be used in conjunction with each continental plot. Fukuoka was the fastest for most of the 1980s. Rotterdam was also featured. Boston was the leading marathon in the early 1990s (and at the start of 1983) until Berlin took over. London features either side of Chicago in the early 2000s, after which Berlin reclaims top position and is 40 seconds faster than the next marathons.
Europe is likely to retain its high average, and not just because of Berlin. There is the possibility of London or Rotterdam taking over again. Other flat and fast marathons are emerging in lesser-known cities because of the size of the winner’s purse and the increasing influx of African talent. Gone are the days of a marathon relying on its history to attract the best. Professionalism is becoming more of a factor, and some elite runners are able to make marathoning their job. However, wealthy sponsors come and go, and so the best big-city marathons of today may not always be won in the fastest times in the future. There is also the tendency to invite only a few of the very top marathoners to run, and were it not for Patrick Makau’s 2:03:38 world record at Berlin in 2011, the winner would have been over four minutes slower. Conversely, in the 2013 Dubai Marathon there were four finishers within eight seconds of the winner who clocked 2:04:45.
Fastest Marathons List The Fastest Marathons List is based on a six-year average with the year that was achieved included. The times in brackets after some marathons relate to what the equivalent sea level time is likely to be. Many marathons have recently made the list, and many more are likely to break 2:20:00 during the 2010s. Some large cities do not have marathons. These are mainly in less-developed countries.
There are large-city marathons that are not always won in times that are fast enough to make the list. Surprising (in developed countries) no-shows in the sub-2:20:00 list include Naples and Genoa in Italy, Wellington in New Zealand, Minsk in Belorussia, Odessa in the Ukraine, Gorki in Russia, Busan in Korea, and Montevideo in Uruguay. In America, Atlanta, San Antonio, St. Louis, Indianapolis, Cincinnati, San Jose, Kansas City, Tampa/St. Petersburg, El Paso, Birmingham, Denver, Toledo, and Tulsa are all above 2:20:00. Some large cities have marathons in adjacent cities or towns close by, especially in Japan.
A few cities have several entries where they have more than one distinct marathon or their marathon over a different course was resurrected after many years’ absence. Other cities with intermittent marathons have had those marathons combined. Some averages are listed with a superscript ‘5’’ by their date, and that denotes a five-year average. This can be over a six-year span where one year the marathon was not held. For example, the huge earthquake in Japan caused some of its marathons to be postponed. If two years are missed, the entry is included below the main list, and if the marathon is plotted the line is dashed. Some countries have been grouped together as befits a region. Some entries have dubious winners in that they or their country have a history of performance-enhancing drugs. Where there is more than one dubious entry, the marathon has an asterisk. Finding the first clean finisher is not practical for the size of this study.
There are likely to be some marathons that I have missed. These are probably relatively new marathons from Japan and Eastern Europe where websites are not in English. There may also be some very old marathons, particularly in Western Europe, that have ceased to exist and whose statistics do not feature on the Association of Road Racing Statisticians (ARRS) website, where most of the data was gleaned. Many thanks go to Ken Young, Andy Milroy, and others from ARRS without whom articles like this are not possible.
Fastest Marathons—Men based on a six-year average using winning times All sub-2:10:00 graphed List comprehensive to sub-2:20:00 Data endeavored to be correct and complete to the end of August 2012 City
Country
Time
Year
1 Berlin 2 London 3 Rotterdam 4 Dubai 5 Paris 6 Fukuoka 7 Chicago 8 Frankfurt 9 Amsterdam 10 Eindhoven 11 Seoul 12 Boston 13 Hamburg
Germany Great Britain & Ireland Netherlands, Benelux United Arab Emirates France Japan USA Germany Netherlands, Benelux Netherlands, Benelux Korea USA Germany
2:04:52.5 2:05:33 2:05:36 2:06:21 2:06:22 2:06:31 2:06:36 2:06:43 2:06:51 2:07:25 2:07:33 2:07:48 2:07:49
2011 2011 2012 2012 2012 2011 2004 (2:06) 2011 2011 2011 2012 2011 2008
14 Lake Biwa, Otsu 15 Prague 16 Vienna 17 New York 18 Tokyo 19 Rome 20 Milan 21 Houston 22 Turin 23 Xiamen 24 Toronto Waterfront 25 San Diego, Rock ’n’ Roll 26 Dublin 27 Beppu-Oita 28 Venice 29 Beijing 30 Reims 31 Enschede 32 Padova, Sant’ Antonio 33 Sea of Galilee, Tiberias 34 Carpi, Ferrari Maranello 35 Zurich 36 Marrakech 37 Linz 38 Hofu 39 Cologne 40 Ottawa 41 Brescia 42 San Sebastian, Donostia 43 Cannes-Nice, Alpes Maritimes 44 Barcelona 45 Dusseldorf 46 Florence 47 Nairobi 48 Hannover 49 Twin Cities Minneapolis/St. Paul 50 Chuncheon
Japan Czech Republic Austria, Alps USA Japan Italy Italy USA Italy China Canada USA Great Britain & Ireland Japan Italy China France Netherlands, Benelux Italy Israel Italy Switzerland, Alps Morocco Austria, Alps Japan Germany Canada Italy Spain, Iberia France
2:08:06 2:08:18 2:08:22 2:08:23 2:08:24 2:08:43 2:08:49 2:08:55 2:08:56 2:09:22 2:09:31 2:09:42 2:09:45 2:09:52 2:09:55 2:09:59 2:09:59 2:10:00½ 2:10:04 2:10:06 2:10:15 2:10:18 2:10:25 2:10:30 2:10:31 2:10:34 2:10:38 2:10:47 2:10:51 2:11:085
2004 2012 (2:07¼) 2012 2011 2008 2010 2008 2012 2002 2012 2011 2006/7 2012 2001 2006 2008 2011 2012 2012 2012 (2:10½) 2011 2012 (2:08¾) 2012 (2:08¾) 2011 (2:09½) 2002 2009 2012 2008 2003 2011
Spain, Iberia Germany Italy Kenya, East Africa Germany USA
2:11:10 2:11:12 2:11:20 2:11:23 2:11:23 2:11:25
2012 2011 2011 2011 (2:05) 2012 1987 (2:10½)
Korea
2:11:29
1997
Istanbul Turkey Los Angeles USA Kosice Slovakia La Rochelle France Shanghai China Mumbai India Warsaw Poland Lyon France Nagano Japan Montreal Canada Ljubljana Slovenia, Balkans Trieste Italy Cleveland USA Torreon, La Laguna Mexico Mainz Germany Eugene USA Treviso Italy Duluth, Grandmas USA Porto Portugal, Iberia Lausanne Switzerland, Alps Belgrade Serbia, Balkans Madrid Spain, Iberia Phoenix, Rock ’n’ Roll USA Seville Spain, Iberia Austin USA Pittsburgh USA Honolulu USA Nobeoka Japan Sydney, Australia Australia Palermo Italy Karlsruhe, Baden Germany Manchester Great Britain & Ireland Sacramento International USA Maassluis, Westland Netherlands, Benelux Thessaloniki, Alexander Greece the Great Brisbane, Gold Coast Australia Auckland before latest phase New Zealand Columbus, Ohio USA Stockholm Sweden, Scandinavia
2:11:31 2:11:32 2:11:33 2:11:39 2:11:41 2:11:41 2:11:42 2:11:43 2:11:43 2:11:46 2:11:46 2:11:51 2:11:52 2:11:55 2:11:58 2:11:59 2:12:04 2:12:08 2:12:16 2:12:27 2:12:34 2:12:38 2:12:42 2:12:44 2:12:47 2:12:49 2:12:55 2:12:55 2:12:585 2:13:00 2:13:03 2:13:045 2:13:08 2:13:12 2:13:14
2011 2011 2010 2011 2011 2012 2011 2001 20125 1986 2011 (2:10¼) 2005 2001 2012 (2:07¾) 2012 1983 2009 1985 (2:10½) 2011 2007 (2:11) 2009 2011 (2:10) 2009 (2:11¼) 2011 2006 1998 (2:12) 2006 2011 1987 1993 2011 1973 1988 1989 2011
2:13:17 2:13:215 2:13:22 2:13:22
1993 1981 1991 (2:13) 1991
Pyongyang Korea Utrecht Netherlands, Benelux Port Elizabeth South Africa Valencia Spain, Iberia Brussels Belgium, Benelux Sapporo, Hokkaido Japan Debno Poland Munich, Median Germany Zhengzhou China San Francisco USA Monte Carlo Monaco/France Singapore Singapore, Southeast Asia Durban South Africa Poznan Poland Athens, Classic Greece Munster Germany Puteaux, Hauts de Seine France Melbourne Australia Ferrara Italy Krakow Poland Taipei International Taiwan, Southeast Asia Chemnitz, Karl Marx Stadt Germany Lisbon Portugal, Iberia Szeged, International Hungary Friendship Cape Town, PeninsulaSouth Africa Mont St Michelle France Toronto, Shoppers Canada Drug Mart Sao Paulo Brazil Nashville, Country Music USA Kassel Germany Odense, H.C.Andersen Denmark, Scandinavia Wiri Auckland, Winstone New Zealand People’s Budapest Hungary Baltimore USA Lille France Graz, Kultur Austria, Alps Bonn Germany
2:13:22 2:13:22 2:13:26 2:13:26 2:13:26 2:13:28 2:13:37 2:13:40 2:13:42 2:13:43 2:13:44 2:13:44 2:13:51 2:13:51 2:13:52 2:13:55 2:13:585 2:14:01 2:14:01 2:14:01 2:14:02 2:14:04 2:14:04 2:14:07
2010 2011 1990 2008 2009 1999 1987 1992 (2:12) 2012 1987 2002 2011 1992 2008 2011 2011 1995 1987 2001 2012 2011 1980* 1995 1990
2:14:08 2:14:12 2:14:165
1988 2004 1995
2:14:16 2:14:21 2:14:23 2:14:26 2:14:27
2011 2008 2012 2010 1986
2:14:27 2:14:33 2:14:35 2:14:36 2:14:38
1987 2011 1993 2010 (2:13¼) 2008
Huntsville, Rocket City USA 2:14:44 Antwerp Belgium, Benelux 2:14:48 Echternach, Zwei Lander Luxembourg, Benelux 2:14:50 Brugge Belgium, Benelux 2:14:56 Egna, Sudtirol Italy 2:15:03 Sandbach, Birmingham Great Britain & Ireland 2:15:06 Miami USA 2:15:08 Every, Essone France 2:15:09 Toulouse France 2:15:105 Dallas, White Rock USA 2:15:11 Regensburg Germany 2:15:14 Caen, Liberte France 2:15:14 Santiago Chile 2:15:25 Dalian China 2:15:25 Vitoria, Martin Fiz Spain, Iberia 2:15:28 International Blumenau Brazil 2:15:31 Piacenza, Placentia Italy 2:15:31 Uzhgorod ex USSR, Ukraine 2:15:32 Omsk, Siberian International ex USSR, Russia 2:15:34 Windsor, Polytechnic Great Britain & Ireland 2:15:38 Leipzig Germany 2:15:38 Guadalajara Mexico 2:15:39 Porto Alegre Brazil 2:15:39 Mazatlan, Pacifico Mexico 2:15:39 Reggio Emilia Italy 2:15:40 Beirut Lebanon 2:15:42 Berchem Belgium, Benelux 2:15:44 Mombasa Kenya, East Africa 2:15:46 Lisbon, Carlos Lopez Portugal, Iberia 2:15:48 Calvia, Majorca Spain, Iberia 2:15:51 Hong Kong China 2:15:58 Waterval-Boven to South Africa 2:16:00 Ngodwana, ElandsValley Belfast Great Britain & Ireland 2:16:00 Detroit USA 2:16:01 Moshi, Kilimanjaro Tanzania, East Africa 2:16:03 Kisumu, Great Lake Kenya, East Africa 2:16:07 Dresden Germany 2:16:07 Long Beach USA 2:16:09
1983 2011 1997 1997 2002 1981 1985 1982 2011 1983 2002 2012 2012 (2:12¾) 2012 2007 1996 2005 1983 1997 1971 2006 2001 (2:09¼) 2002 2005 2011 2011 1990 1995# 2009 1991 2009 1996 (2:10½) 2012 1983 2012 (2:12¾) 2010 (2:11½) 2010 1990
Wolverhampton Great Britain & Ireland Carlsbad USA Neuf Brisach France Buenos Aries Argentina Marathon, Olympic Day Greece Wroclaw Poland Rome, San Silvestro Italy Oslo Norway, Scandinavia Kochi Japan St. Petersburg, White Nights ex USSR, Russia Pune India Artturin, Paavo Nurmi Finland, Scandinavia Christchurch New Zealand Arusha, Mount Meru East Africa Tanzania, Sama de Langreo, Spain, Iberia Asturias Valle del Nalón Newport, Ocean State USA Aubigny sur Nere, Cher France Hamilton New Zealand Caracas, Navidad Venezuela Harlow Great Britain & Ireland Las Vegas Rock ’n’ Roll USA Luxembourg Europe Luxembourg, Benelux Mexico City Mexico Helsinki Finland, Scandinavia Kuala Lumpur Malaysia, Southeast Asia Vancouver Canada Essen Rund um den Germany Baldeneysee Richmond, Virginia USA Porto San Giorgio, Piceno Italy Canberra Australia Nice France Drammen Norway, Scandinavia Winnipeg, Manitoba Canada Duisburg, Rhein-Ruhr Germany Nantes France Macau (China) Otwock Poland
2:16:115 2:16:15 2:16:16 2:16:17 2:16:18 2:16:18 2:16:26 2:16:32 2:16:33 2:16:33 2:16:37 2:16:405 2:16:40 2:16:40
1987 1993 1980 2011 1974 2007 1986 1986 2012 2012 2002 (2:13¼) 1976 1986 1997 (2:11)
2:16:40
1997
2:16:42 2:16:43 2:16:48 2:16:485 2:16:50 2:16:51 2:16:51 2:16:52 2:16:58 2:16:58 2:17:01 2:17:03
2002 1998 1978 2002 1978 2009 (2:14½) 2012 2002 (2:07) 1993 2012 1984 1987
2:17:03 2:17:03 2:17:04 2:17:04 2:17:07a 2:17:09 2:17:10 2:17:12 2:17:13 2:17:17
2006 2007 1984 (2:14¾) 1990 1983 1984 1991 2000 1996 1982
Riga ex USSR, Latvia Taranaki to New Plymouth, New Zealand Mountain to Surf St. George, Utah USA San Luis Potosi, Mexico Tangamanga Geneva Switzerland, Alps San Diego, Heart USA Culver City USA Marseille France Kawaguchi Japan Lac d’Anncey France Jacksonville USA Albi France Russi Italy Hartford USA Hamilton Bermuda Hangzhou International China Rio de Janeiro Brazil Seattle, Emerald City USA Visegrad, Futokarneval Hungary Sofia Bulgaria, Balkans Milan (original versions) Italy Assemini, Sardinia Italy Monza Italy Culiacan Mexico Quad Cities-Moline USA Tucson USA Philadelphia USA Moscow, Peace ex USSR, Russia Prazsky Czechoslovakia Gyeongju, Cherry Blossom Korea Les Herbieres France Livorno Italy Leon Mexico Bratislava, Danube Slovakia Gdansk Poland Vise, Maas Belgium, Benelux Podgorica Montenegro, Balkans Long Branch, New Jersey USA
2:17:17 2:17:20
2012 1992
2:17:21 2:17:22
1998 (2:12½) 2002 (2:09¾)
2:17:23 2:17:25 2:17:26 2:17:26 2:17:26 2:17:26 2:17:27 2:17:27 2:17:30 2:17:39 2:17:42 2:17:43 2:17:43 2:17:44 2:17:45 2:17:46 2:17:50 2:17:52 2:17:53 2:17:53 2:17:54 2:17:56 2:18:04 2:18:04 2:18:07 2:18:11 2:18:12 2:18:16 2:18:16 2:18:17 2:18:18 2:18:20 2:18:20 2:18:23
2010 1987 1976 1990 1995 2011 1989 2000 2008 2007 1984 2011 2012 1988 1989 2000 1987 1995 1986 2010 2011 1984 1986 1994 1978 2010 1991 2003 2008 (2:10¾) 2000 2001 2004 2011 1983
Virginia Beach, Shamrock USA Florianopolis, Santa Catarina Brazil New Delhi India St. Wendel Germany Salt Lake City USA Portland USA Soweto South Africa Seaside, Trail’s End, Oregon USA Matsuyama, Ehime Japan Bologna Italy Izumisano, Senshu Japan Copenhagen Denmark, Scandinavia Zaragoza Spain, Iberia Washington, Marines USA Green Bay USA Tsukuba Japan Otterndorf, Kusten Germany Pisa Italy Kigali, Peace Rwanda, East Africa Tenero, Ticino Switzerland, Alps Louisville, Derby Festival USA Rotorua New Zealand Noumea New Caledonia Inverness to Forres, Great Britain & Ireland Loch Ness Salzburg Austria, Alps Vantaa Finland, Scandinavia Benidorm Spain, Iberia Port of Spain Trinidad & Tobago Sydney Australia
Buffalo to Niagara Falls Intl. USA & Canada Merano Italy Turku, Paavo Nurmi Finland, Scandinavia Milton Keynes Great Britain & Ireland Toyohashi Japan Columbia Carolina USA Huddersfield Great Britain & Ireland Appleton, Fox Cities USA Maclean to East London, Africa
2:18:23 2:18:23 2:18:23 2:18:245 2:18:25 2:18:28 2:18:32 2:18:36 2:18:36 2:18:38 2:18:38 2:18:39 2:18:395 2:18:40 2:18:40 2:18:41 2:18:41 2:18:41 2:18:42 2:18:43 2:18:43 2:18:49 2:18:50 2:18:51
1988 2007 2012 2011 2009 (2:13) 1994 2004 (2:12) 1975 2003 1992 2007 1988 2011 1983 2010 1998 2005 2006 2012 (2:12½) 1992 2007 1989 2011 1971
2:18:51 2:18:52 2:18:53 2:18:56 2:18:56 2:15:384 2:18:57 2:18:58 2:18:595 2:18:59 2:19:03 2:19:05 2:19:06 2:19:06 2:19:07
2012 (2:17) 1981 1993 2003 2011, 1998 1982 1990 1977 1980 1969 1982 1974 1995 1990
Buffs South Hull Great Britain & Ireland Curibita Brazil Santa Rosa, Pampa Treviesa Argentina Bekkai, Pilot Japan Milwaukee Lakefront USA Aberdeen Great Britain & Ireland Memphis, St. Jude USA Seattle USA Bolton Great Britain & Ireland Bilbao Spain, Iberia New Orleans, Mardi Gras USA Invercargill New Zealand Zagreb Croatia, Balkans Bangkok Thailand, Southeast Asia Khon Kaen Thailand, Southeast Asia Radenci, Three Hearts Slovenia, Balkans Kandel, Bienwald Germany Swakopmund, Lucky Star Namibia Savannah USA Lincoln, Nebraska USA Hawassa, Abebe Bikila Ethiopia, East Africa
Korolev Kosmocheskiy ex USSR, Russia Charlotte USA Swakopmund, Rossing Namibia Salt Lake City, Deseret News USA Jacksonville Beach USA Mexicali Mexico Merida Mexico Manila, Philippine Air Lines Philippines, Southeast Asia Bari Italy Atlanta USA Sasolburg South Africa Isezaki, Gunma Japan Auckland restarted New Zealand Avenue of the Giants USA Calderara di Reno, Italy Eco nell Oasi d. Fiume Monterrey Mexico
2:19:135 2:19:13 2:19:14 2:19:17 2:19:18 2:19:24 2:19:25 2:19:27 2:19:275 2:19:27 2:19:28 2:19:28 2:19:31 2:19:31 2:19:33 2:19:36 2:19:37 2:19:37 2:19:38 2:19:40 2:19:40 2:16:455 2:19:43 2:19:45 2:19:47 2:19:50 2:19:515 2:19:52 2:20:00a 2:20:02 2:20:02 2:20:07 2:20:03 2:20:13 2:20:13 2:20:19 2:20:29
1991 2008 (2:15¾) 2005 2003 1986 1984 2009 1983 1986 2000 1983 1993 2011 2012 2012 2008 1986 1997 1984 1983 (2:18½) 2008 (2:12½), 2012 1998 1984 1997 1984 (2:14½) 2012 2007 1994 1987 2003 1979 2012 (2:14) 1986 1997 1978 2004
2:20:46
2011 (2:18¾)
St Louis, Third Olympiad USA Omaha USA San Antonio USA
Napa Valley USA Edinburgh Great Britain & Ireland Carmel, Big Sur International USA St Louis USA Johannesburg, Jackie Gibson South Africa
2:21:04 2:21:12 2:21:13 2:20:20 2:21:42 2:21:44 2:21:51 2:21:55 2:24:09
1980 1986 (2:20) 1985, 2011 restarted 1990 2009 2003 1985 1984 (2:16¾)
Marathons without a block of five or more consecutive marathons: Daegu Korea 2:08:204 2012 Casablanca Morocco 2:11:394 2011 Verona Italy 2:13:103 2011 Nagpur India 2:15:383 2011 Bucharest since restart Romania 2:16:544 2011
Great British & Irish marathons probably under 2:20:00: Birmingham probably sub-2:16:00 mid-end 1980s Liverpool probably sub-2:18:00 end 1980s Middlesborough probably sub-2.18:00 start 1980s Derby probably sub-2.20:00 end 1980s Key ( )
time adjusted for sea level 2:xx:xx5 average for five marathons 2:xx:xx4 average for four marathons 2:xx:xx3 average for three marathons * includes several questionable performances # probably quicker in the late 2000s but for course being short
a approximate Short courses rounded up where distance short is known. j joint or tie
Marathon Medal Table—Men Based on gold for sub-2:10:00 (3 points), silver for sub-2:15:00 (2 points), and bronze for sub-2:20:00 (1 point) Rk. Country
Gold Silver Bronze Pts.
1 USA 2 Italy 3 Germany 4 France & Monaco 5 Japan 6 Benelux, Netherlands, Belgium & Luxembourg 7 Great Britain & Ireland 8 Iberia, Spain & Portugal 9 China 10 Alps, Switzerland & Austria 11 Canada 12 Poland 13 South Africa & Namibia 14 Scandinavia, Norway, Sweden, Finland & Denmark 15 New Zealand 16 Mexico 17 Korea 18 Australia 19 Balkans, Croatia, Slovenia, Serbia, Bulgaria, Montenegro 20 East Africa, Kenya, Ethiopia, Tanzania & Rwanda 21 Southeast Asia, Thailand, Malaysia, Taiwan
& Singapore 22 Czech Republic & Slovakia 23 Brazil 24 Ex USSR, Russia, Ukraine & Latvia 25j Greece 25j Hungary
5 4 3 2 4 3 2 0 2 1 1 0 0 0 0 0 1 0 0
15 8 10 7 4 7 1 7 2 4 3 4 3 2 2 1 2 3 2
36½ 13 8 11 7 3 15 7 4 3 2½ 3 5 7 5 7 1 2 4
81½ 41 37 31 27 26 23 21 14 12 11½ 11 11 11 9 9 8 8 8
0
1
6
8
0 1 0 0 0 0
2 1 1 0 2 2
3 2 5 6 1 1
7 7 7 6 5 5
The medal table shows that the USA has the greatest number of high-quality marathons. The half a point is shared with Canada because the Niagara Falls International Marathon enters both countries. Most North American marathons are not run under 2:20:00, and in terms of population the score is low. Western Europe has many more high-quality marathons, the Netherlands being most efficient for its population as are Italy and Germany. Japan is high on the list and
specializes in quality rather than quantity, as its four gold and four silvers show. France recently overtook Japan to make fourth on the table by way of the new Alps Maritimes and Toulouse Marathons. The countries of the ex-USSR including Russia have no gold or silver medals, which is unusual given the home-grown talent there. China is rapidly moving up the table, and East Africa is also making progress, just making the top 20. India is likely to make the top 25 soon, and Morocco is not far off. * * * Kenya and Ethiopia may have the greatest marathoners but are very far from winning the accolade of holding the greatest marathons. For a marathon to be great and truly international, it must attract the world’s best runners. To cement event status, the winner needs to finish in a very fast time. The big cities of Europe, America, and Japan have the greatest marathons. The staging of a big-city marathon certainly means more to a nation than a win by a home-grown runner in a faraway place. A marathon star may inspire a nation or even kick-start a running revolution, but the actual revolution was the millions who ran the marathons that followed. There does not have to be a home-grown winner for a nation to be proud of its marathons, although that does help. Great city marathons build up their countries’ identity. They attract those who would not ordinarily run a marathon unless the capital staged a massive race. And to be in a race where the male winner ran close to two hours makes you part of a special event. Correction to the Masters Marathon Trends article in the July/August 2011 M&B: Bernie (Bernadine) Portenski is from New Zealand, not Australia.
This article originally appeared in Marathon & Beyond, Vol. 17, No. 3 (2013).
← Browse the full M&B ArchiveMore like this
1,000+ stories from 19 years of Marathon & Beyond
The complete archive of the legendary long-distance journal — digitized and free to read.
