

Fastest Marathons By Event And Theirtrends—Women
Every year, big-city marathons such as New York, Boston, London, and Berlin are won in fast times. For example, three women’s world records have been set in Berlin. However, that marathon has not always attracted the very top runners, the female winner clocking 3:07:07 in 1979. The winning times from year to year can be used to determine which marathons are consistently won in the fastest times. This study will do just that and go further to reveal how fast or slow the major marathons of the world have been won in throughout the last three decades. The men’s version of this study was featured in the May/June 2013 issue of M&B.
The graphs on the following pages contain plots for marathons particular to a continent. For example, the North American East Coast & Midwest Marathons graph includes plots for New York, Chicago, Boston, Houston and five other large marathons. Each plot is a line through time representing an ongoing sixyear average based on the winning times. For example, the Boston Marathon’s women’s six-year average for the year 2011 is the addition of the winners’ times for 2006 + 2007 + 2008 + 2009 + 2010 + 2011, all divided by six. That is the six years leading up to and including 2011, and the following details the calculation:
The ongoing average for 2012 is 14:39:24 minus Rita’s 2:23:38 of 2006 plus Sharon Cherop Chemutai’s 2:31:50 winning time for 2012, making 14:47:36 divided by six, which is 2:27:56. So every year a rolling six-year average is determined.
A six-year average is found because that is suitable for a trend to be seen. If the winning time each year were used, the resulting plots are likely to be somewhat haphazard trying to account for anomalies. In the example of the Boston Marathon, the winning time in 2009 is relatively slow and 2011 is faster than usual. These two anomalies cancel each other out. If too many years are used, the plot is overly smoothed and the trends unresponsive or even lost. That is, it
Boston Marathon six-year average for the year 2011 1
2
3
4
5
6
Average
2006
2007
2008
2009
2010
2011
2011
2:23:38
2:29:18
2:25:25
2:32:16
2:26:11
2:22:36
2:26:34
Rita Cheptoo Sitienei
Lidiya Grigoryeva
Dire Tune
Salina Kosgei Chebet
Teyiba Erkiso Waka
Carolina Cheptonu Kilel
–
Kenya
Russia
Ethiopia
Kenya
Ethiopia
Kenya
–
14:39:24 total time for six marathons / 6 years = 2:26:34 ongoing average for 2011
takes too long for the plot to respond to what is happening in reality. A six-year average incorporates a few years of lag, be that where there are sudden changes in performance, although for our purposes six years are suitable to reveal the greater picture, which is what we are looking for.
For an event to be won in a consistently fast time, the weather, the nature of the course, the attraction of the event and so forth must always be good. That, as we will find out, is not always the case even for a major marathon where fast times usually come with big financial rewards. However, the money on offer, the prestige, and the size of a marathon usually dictate the level of competition running and subsequently the quality of the winner’s time. Providing there is a very good elite field, only difficult weather conditions for running or freak events can spoil a marathon’s low finishing-time streak. Of course, factors beyond the marathon such as an earthquake or war can interrupt or even bring to an end a marathon. We will not focus on the names that keep winning marathons but will look at the trends by event in terms of just time. In doing so, we can race marathons against each other, seeing which ones are won in the fastest times and when.
In the January/February 2010 issue of M&B, we looked at the Women’s World and National Yearly Marathon Best-Time Trends. Analysis by event ought to parallel that according to the overall trends of each country. We will identify any exceptions; after all, countries like America are vast enough to accommodate different marathon trends.
We will look at the fastest-won marathons by country and continent. Countries and continents have national and international championships. These tend to shift locations, and our analysis does not include such races unless they are held each year in the same place. So the Olympics and World Championships do not feature here. We will amalgamate the plots for the best marathons on each continent so that the marathon power of each continent can be put in perspective of the others as well as seeing which race was consistently the fastest in the world for any
given date in the modern era. The women’s graphs will be compared to the men’s and the fastest marathons for both sexes identified. There is also a medal table by country on page 64 based on the best six-year average for almost 200 marathons.
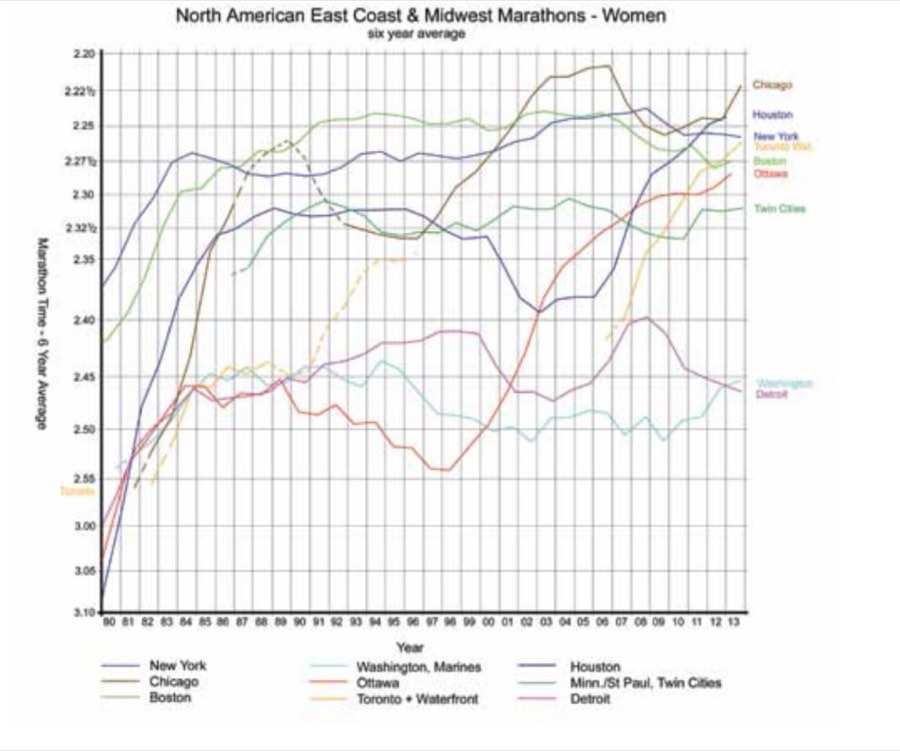
North American East Coast and Midwest The women’s North American East Coast & Midwest marathons show rapid development in the 1980s. America was instrumental in pioneering women’s marathon running, and the marathons of Boston and New York were run the fastest. Grete Waitz of Norway won the New York Marathon five times in a row, nine times in all, and personally ensured that New York was the leading marathon in America throughout much of the 1980s. We will see whether New York was also the leading marathon in the world, European marathons offering stiff competition. By the start of the 1990s, the winner’s times of Boston and New York, along with those shown on the graph with the exception of Detroit, had reached a plateau. During the 2000s, some marathons experienced faster times than before. The trends
above fit the US and world cycle of boom, plateau, and improvement, the latter not evident in every US marathon. By the 2000s, the Chicago Marathon joined and then surpassed the big two of Boston and New York. The six-year average for Chicago peaked under a scintillatingly fast 2:21:00, but since 2006 bad weather conditions have caused the average to slow. Chicago’s plot has almost recovered but historically is either up or down, as if that marathon’s cycle is very sensitive. The Chicago Marathon was not held in 1987, and so part of its plot is dashed.
The Houston Marathon has recently joined America’s big-three fast marathons and had the six-year average at the start of 2013. Yet the prize money at Houston is many times less than that on offer at Chicago, Boston, and New York, bucking the trend of megabucks being required to buy a very fast marathon time. Houston is held in the middle of winter when there are no other prestigious marathons staged across continental America. In that respect, Houston has an advantage, although it does have competition from many Japanese marathons also held during the winter. The Canadian duo of Ottawa and the relatively new Toronto Waterfront Marathon both have seen increasingly fast times in the last decade and have yet to reach a plateau. Toronto Waterfront has even overtaken Boston and may also surpass New York. Twin Cities is very consistent, being won from 2:30:00 to 2:33:00. The Marine Corps Marathon at Washington attracts no fast elite runners. The elite typically run where there is plenty of prize money, and in that respect any marathon could burst on the scene big-time as has happened on other continents.
Duluth Grandma’s, Cleveland, Columbus, Pittsburgh, Austin, Dallas White Rock, Nashville Country Music, and Newport Ocean State all have six-year best averages under 2:35:00 in the last decade, albeit Pittsburgh’s peak being earlier. Philadelphia, Montreal, and Miami are slower, which is surprising given the size of those cities.
North American West Coast and Rockies Marathons in the West Coast and Rockies are not won in as fast times compared with those on the East Coast and prairies. The men’s article offered reasons why and also noted that there were women’s world records set at Eugene and Culver City. Culver City peaked in 1978 with a 2:49:22 six-year average and was one of the fastest marathons in America. The West Coast was at the forefront of marathoning during the 1970s, but since the 1980s many of its marathons slumped into long-term decline in terms of winning times. The Avenue of the Giants, Humboldt Redwoods, Big Sur
International, and San Francisco Marathons are being won in times often slower than three hours. The San Francisco Marathon is a particularly poor performer, given the importance of the city, although Seattle is worse. The slack has not been taken up by Vancouver across the border in Canada. Napa
Valley is making a comeback, and other marathons are also on the up. Los Angeles is currently the best in the West but has competition from San Diego. San Diego is one of many Rock ’n’ Roll marathons. Las Vegas and in particular Phoenix are other Rock ’n’ Rollers that could break 2:30:00 for a six-year average soon.
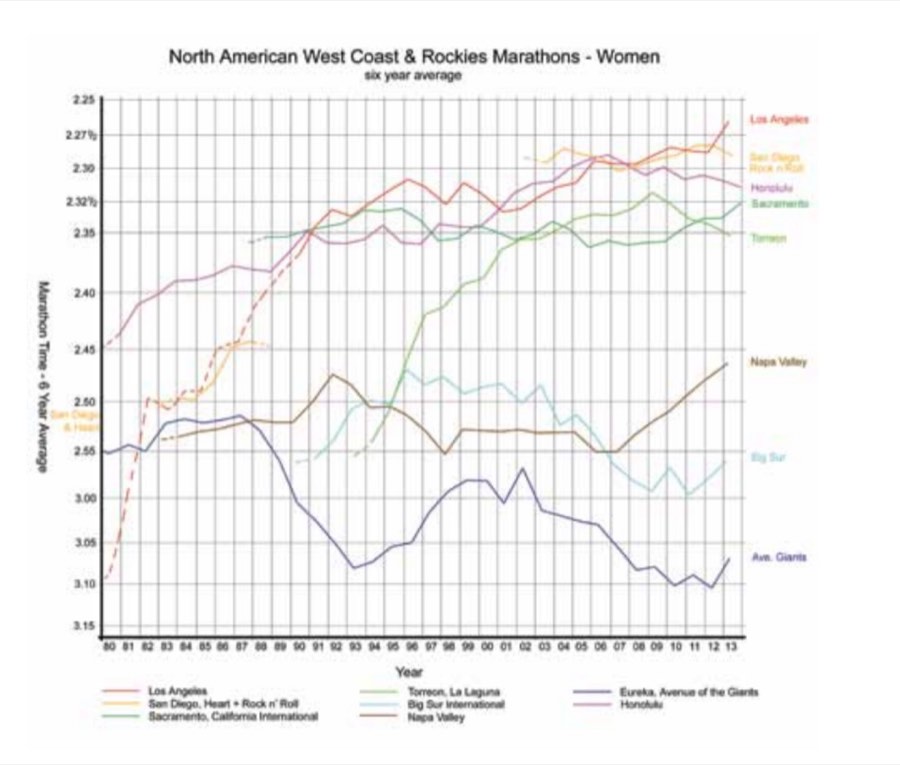
The Honolulu Marathon matured, reaching a plateau around 2:30:00. The downhill course of Sacramento stays within 2:35:00 and 2:32:00 for the winner’s average. That is the same as La Laguna in Torreon, Mexico, although the standard there is higher because of the altitude. The altitude in the Rockies slows marathon times, and the major centers of Salt Lake City and Denver do not compare to the best in the West. Only some in Mexico offer real competition.
Women’s American marathons are being increasingly won by East Africans. That trend is not as pronounced as with the men. Europeans and Japanese also help push up standards. That was less likely in the 1980s owing to lack of opportunities for runners to compete overseas, so there were many more homegrown winners several decades ago. Today it is quite rare for an American woman to win a major American marathon. The trends for the winning times are improving, but that does not indicate that American women are getting faster in strength and depth.
The American ladies as a strong collective have their say in the development of the marathon, leaving the afterglow for other countries.
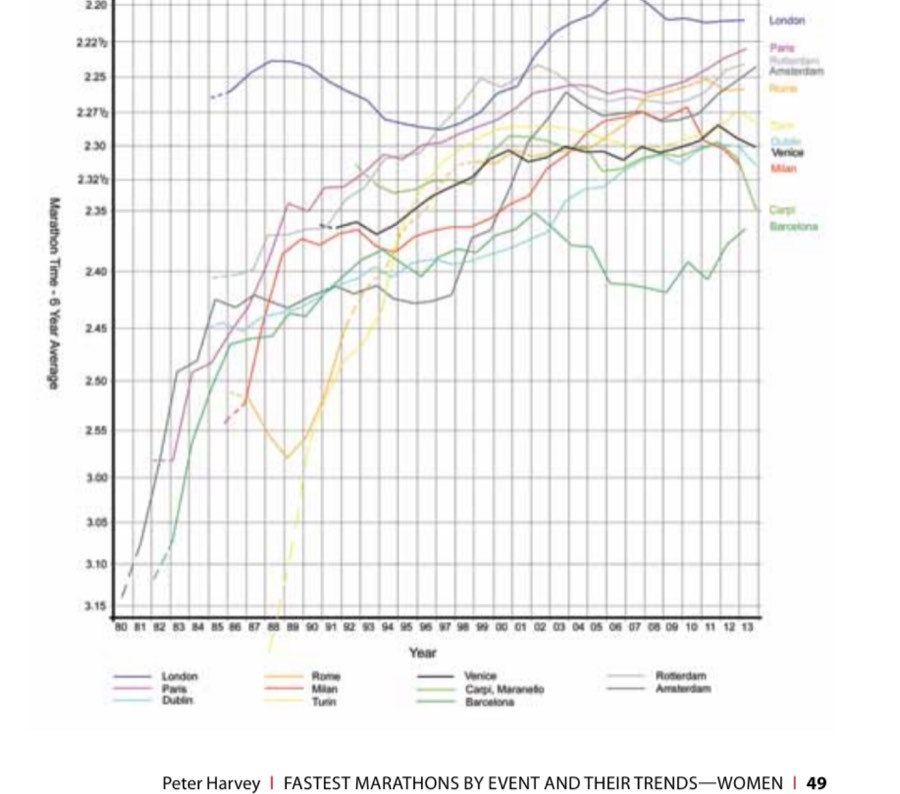
Western Europe The growth of the European marathons lagged behind America. An exception was London in England, which surpassed New York and Boston by the mid-1980s. The London Marathon rises above the rest as Western Europe’s premier marathon. No other marathon in Western Europe (except Paris in 2013) has a six-year average faster than that of London’s sub-2:24:00 initial peak in the late 1980s. In the 2000s, London’s six-year average dipped well below 2:20:00, which included Paula Radcliffe’s world record, one of five world records set there. Across the Irish Sea, Dublin has recently broken 2:30:00, although its plot has locally dipped.
London was eclipsed by Rotterdam during the late 1990s. Another from the Benelux is the Amsterdam Marathon, which also has strong fields. The Benelux is the land of the flat marathon and has a clutch averaging under 2:40:00. Paris has a convex curve to the start of the millennium and then after a period of consolidation pushed upwards and may even challenge London in a few years. There are many French marathons with a sub-2:40:00 six-year average, including a trio on the Cote d’Azur. Italy has more quality, with five marathons peaking below 2:30:00. Florence, Treviso, and Padova are all under 2:32:00. Initially, Carpi had the fastest times, followed by Turin and Milan. Rome rules Italy today. The leading Italian marathons are all experiencing recent decline, although Rome is the least affected. Milan’s prize money has been slashed by 60 percent since 2008.
Spain and Portugal (Iberia) do not have very fast marathons, none with a sixyear average below 2:30:00 by the summer of 2013 to guarantee inclusion on a graph. Lisbon, San Sebastian, and Seville have faster peak averages than Barcelona, which is significantly improving. Madrid and Valencia have peaks just below that of Barcelona. Iberia has too many eggs in one basket rather than one Faberge.
Central, Northern, and Eastern Europe Eastern Europe has the Berlin Marathon, which shows a concave curve. Berlin took time to mature and came to prominence at the turn of the millennium. Marathons at Hamburg and Frankfurt took off after the fall of the Iron Curtain in the late 1980s, and Frankfurt is approaching the lofty heights of Berlin. Germany’s other strong marathons include Dusseldorf (just recently qualified for inclusion on the graph), Cologne, Hannover, and Mainz. Surprisingly, Munich, Germany’s third largest city, lags behind. Vienna and Linz in Austria, Zurich in Switzerland, and Prague in the Czech Republic have successful/fast marathons, the latter rising strongly. Throughout the 1970s and 1980s, parts of Eastern Europe were athletic powerhouses, but as the women were not encouraged to run marathons, there is not much worth plotting back then, including nose-diving Budapest in Hungary (which was plotted in the men’s article).
There were some exceptional Scandinavian women marathoners during the 1980s. They had outgrown marathons in their own countries, leaving the averages of capital cities Stockholm, Oslo, Copenhagen, and Helsinki to reflect third class. Stockholm managed to break 2:35:00 in the early 1990s, and Scandinavian marathon winning times have long since been in decline.
Russia was shown to have positive growth in the women’s marathon-trend article, but that is not paralleled by its marathons. Moscow is the Marine Corps of Russia, with relatively slow winning times for a major capital city. The Siberian Marathon at Omsk, shown on another graph, is far faster. Poland has many marathons, which are won close to 2:40:00. Belgrade was the best of the Balkans, but
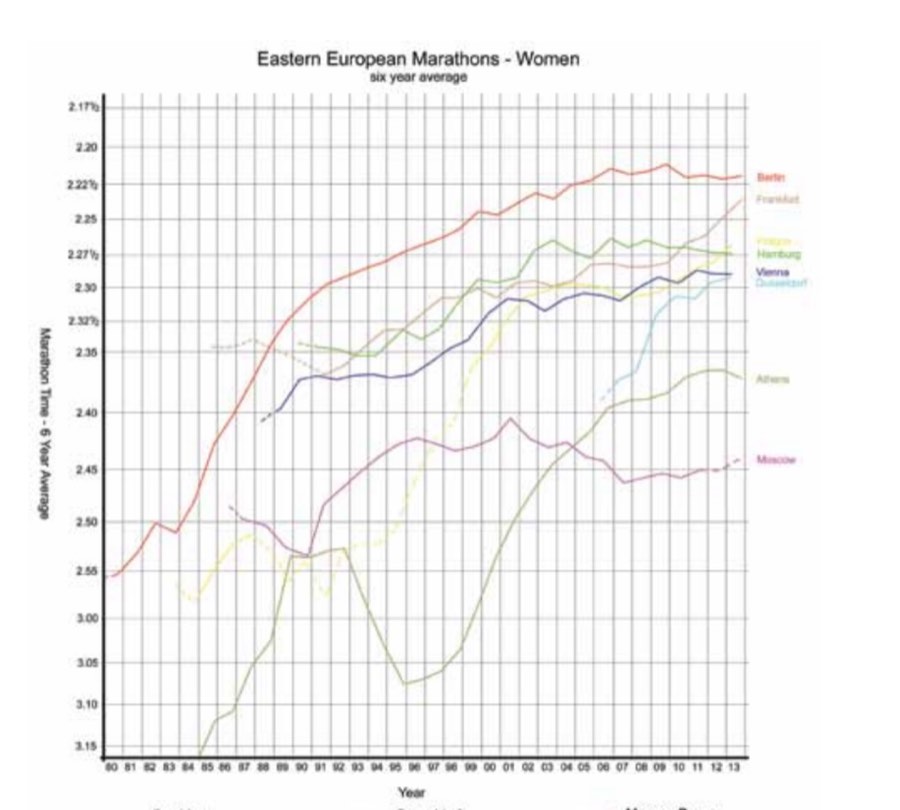
Ljubljana in Slovenia has recently rocketed and is likely to go sub-2:30:00 soon. Farther south, the Athens Classic Marathon in Greece is experiencing a renaissance.
The Orient The graph for the Oriental marathons has a distinctly different start compared with the other continents. The Oriental plots suddenly arrive at a relatively high standard without the customary Western-style introduction. That is because women barely competed in the late 1970s, so no plots exist until the 1980s. Japan is the main contributor of fast marathons in the Orient. Japan does things differently than the rest of the world by staging international elite races without mass participation behind, although that is starting to change. There are also “women-only marathons.” Of these, Osaka has been the most successful over the years. Yokohama
and Nagoya follow the same trend, the latter most affected by the fairly recent earthquake in 2011. The Japanese marathon trends are more deliberate and measured compared with other countries. That makes predicting their future easier, and the trends indicate that a plateau should be sustainable around 2:24:00 for their fastest marathons. Nagano, Sapporo, and the new marathon of Tokyo are other high-quality Japanese races, but there is not much else to back these up, as if the mentality is to only do something well, otherwise not at all.
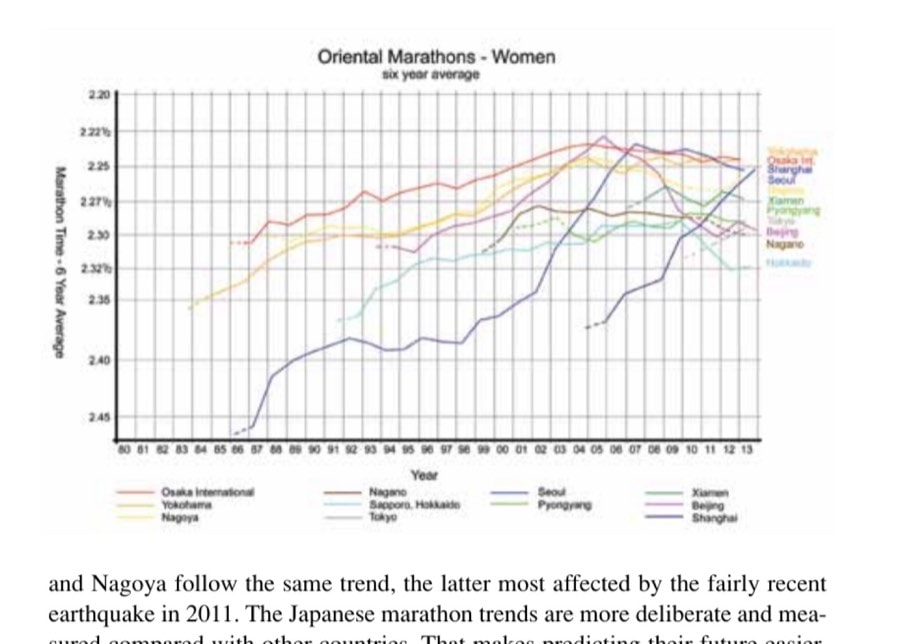
Many Japanese and South Korean marathons came into being at the end of the 1980s. The Chinese and North Korean marathons took longer to emerge, although they did make swift progress. China via Beijing briefly stole Japan’s thunder in 2005, but that was probably achieved in part by Chinese runners ordered to consume performance-enhancing drugs. Shanghai has emerged as a rival to the top Japanese and Korean marathons. Xiamen is ticking along well, as are Dalian, Hong Kong, and the new marathon of Zhengzhou. South Korea also has an up-and-coming new marathon—Daegu— to complement Seoul, which rose to power in the 2000s, plus the declining Chuncheon Marathon. North Korea has Pyongyang and Gyeongju, although as in China, very few runners get invited to compete from “outside.” In that respect, the Chinese and North Korean marathons’ growth are limited because of the lack of worldwide integration.
Oceania and the rest of Asia New Zealand and Australia showed promise in the 1980s with Auckland, Sydney, and Melbourne peaking around 2:40:00 back then. Only the Gold Coast Marathon
at Brisbane and Melbourne ended up surpassing that mark. Australia’s largest city, Sydney, was a similar standard to Melbourne but Sydney’s plot is in chunks, having missed a number of years, and has not picked up in recent years. A peek at the prize money (lack of) gives the answer, although Sydney has stumped up a bit more cash in the last two years, and there has been steady improvement.
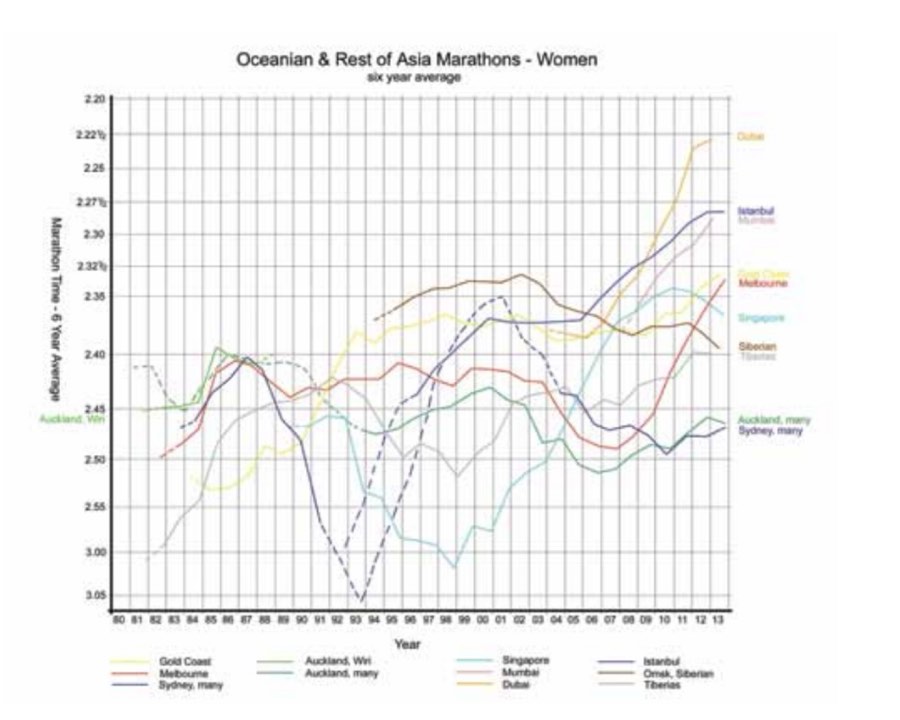
Unlike Australasia, fast marathons are being run in Dubai. The growth there has been phenomenal, fueled by a generous flow of presumably oil-based prize money. India is another growth area, and despite the climate, the Mumbai plot has just broken 2:30:00. There is a prestigious half-marathon in Delhi but no other marathons of note on the subcontinent. India could be the next country to experience a marathon boom. Southeast Asia has the Singapore Marathon and the considerably slower Bangkok in Thailand. The (wider) Middle East has two marathons that stand out, Istanbul in Turkey and Tiberias on the Sea of Galilee in the Valley of Jordan. Tiberias is below sea level, which slightly assists the runners because of the increase in oxygen. Istanbul’s marathon is emerging, whilst other big cities in the Middle East do not even have a marathon. The instability in the Middle East does not help. The dissolution of the USSR probably released Omsk to stage the Siberian Marathon, which is the highest plot in Asia from 1994 to 2005.
South America and Africa The major South American marathons have recently come together in the same positive trend. Santiago in Chile, Buenos Aries in Argentina, and Rio de Janeiro in Brazil are rising fast, and the 2016 Olympics in Brazil is likely to fuel more growth. The standard is still relatively low, with only Sao Paulo and Santiago having averages bettering 2:40:00. That was matched 10 years ago by the Brazilian marathon of Porto Alegre, which has long since been in decline. Other South American countries have marathons, usually in their capitals, but the standards are low.
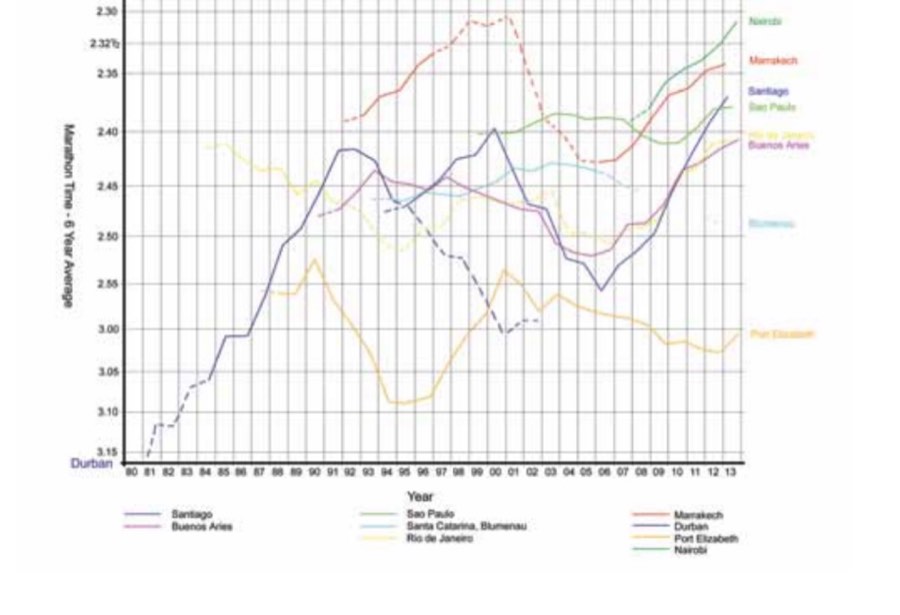
There are new marathons in Africa, including Casablanca in Morocco and Nairobi in Kenya. Nairobi’s best six-year average, accounting for the altitude, translates as 2:24¼. Given the altitude, heat, and lack of infrastructure, East Africa is not the ideal place to stage a grand marathon run in a fast time. There are a number of marathons in East Africa, but women typically have minimal presence. Marrakech in Morocco has a haphazard history but is on the up. The marathons of South Africa are going the opposite way, as shown by Durban and Port Elizabeth. No doubt the problems the country is facing (including a significant exodus) have an impact.
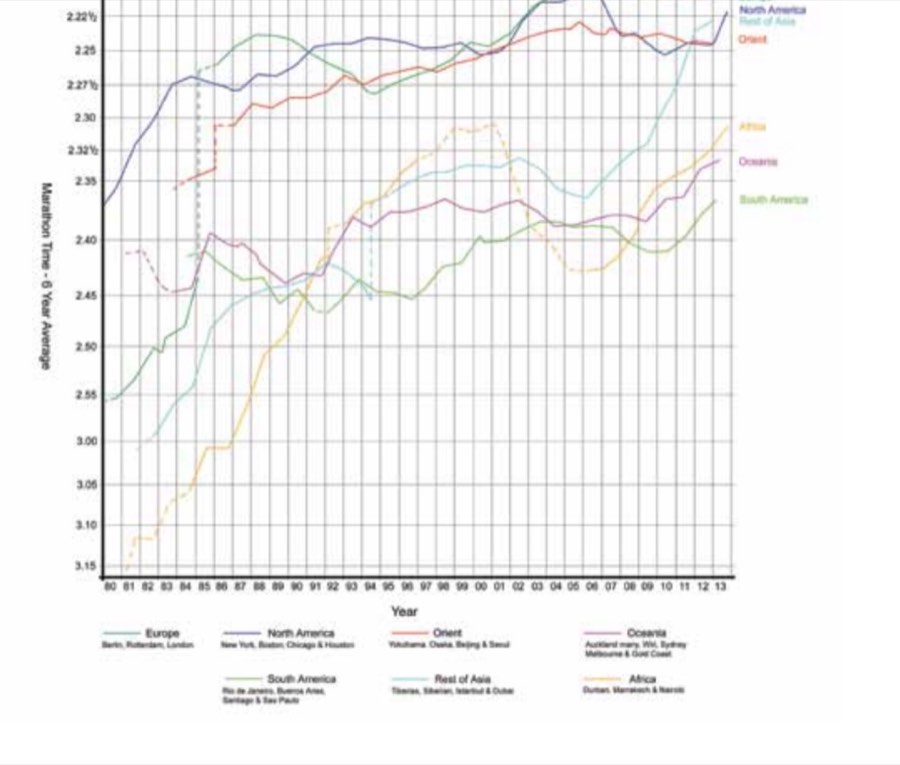
Continental bests Each continental plot represents the fastest marathon for any given year. Where a new marathon arrives and is the fastest, the plot jumps vertically upward. The women’s continental bests show that North America, Europe, and the Orient have historically led the way. The other regions compare with each other at a lower standard. The exception is the recent rise of the rest of Asia, and that could even overtake North America soon.
The New York City Marathon oversaw the initial modern-day improvement of the women’s marathon. London took over in the second half of the 1980s. The baton was returned to North America throughout the 1990s by way of the Boston Marathon. In the next decade, Berlin was the premier event, followed briefly by Rotterdam until London took over again and remains at the top. The crown may
pass to the rest of Asia because of Dubai. We noted that Dubai has a rich purse and has helped propel the trend of more money for the winners. Prize money as a collective amount for all road races has doubled every 10 years from 1990. At the start of the 1980s there were token scraps, but by the end of the decade there was arguably enough support for all top marathoners to go professional.
The Orient has the most consistent plot and although recent years indicate a slight decline, the nature of their trend implies that is unlikely to sink much lower. The European and North American plots oscillate more. South America, Oceania, and Africa are expressing new growth from lows during the mid-2000s.
Fastest Marathons List The Fastest Marathons List is based on a six-year average, with the year the peak was achieved included. The times in parentheses after marathons held at altitude (even if that is at low level) relate to what the equivalent time is likely to be if the race were run at sea level. Every marathon with a six-year average faster than 2:40:00 has, I hope, been included. Most under 2:42:00 are also featured, along with some significant others. Some large-city marathons do not make the list. Surprising (in developed countries) no-shows on the sub-2:42:00 list include Washington Marine Corps, Seattle, Atlanta, and St. Louis, with Buenos Aires just under. Japan lacks high-quality marathons in many of its cities, instead specializing in a few top-quality marathons. China is likewise, and there is much potential for many new large marathons there.
A few cities have several entries where they have more than one distinct marathon or their marathon was resurrected after many years. Other cities with intermittent marathons have had those marathons combined. Some averages are listed with a “5” by their time, and that denotes a five-year average. This can be over a six-year span where one year the marathon was not held, for example because of a hurricane. Some countries have been grouped together as befits a region, ensuring that very similar cultures are truly represented in the medal table. Some marathons have dubious winners by way of an athlete (or a country’s regime) taking performance-enhancing drugs. Where there is more than one dubious entry, the marathon has an asterisk. Identifying the first clean finisher is not practical for the size of this study.
There are likely to be some marathons that I have missed. These are probably relatively new marathons from the Orient and Eastern Europe where websites are not in English. There may also be some older marathons in Western Europe whose statistics are not featured on the Association of Road Racing Statisticians (ARRS) website, where most of the data was gleaned. Many thanks go to Ken Young, Andy Milroy, and others from ARRS, without whom articles like this are not possible.
Fastest Marathons—Women based on a six-year average using winning times List comprehensive to sub-2:40:00, most included under 2:42:00 Data effectively complete to end of 2013 for sub-2:40 entries, rest to summer 2013 City Country 1 London Great Britain & Ireland 2 Chicago USA 3 Berlin Germany 4 Beijing China 5 Dubai United Arab Emirates 6 Paris France 7 Osaka Japan 8 Seoul Korea 9 Frankfurt Germany 10 New York USA 11 Boston USA 12 Rotterdam Netherlands, Benelux 13 Yokohama Japan 14 Amsterdam Netherlands, Benelux 15 Houston USA 16 Nagoya Japan 17 Rome Italy 18 Shanghai China 19 Xiamen China 20 Los Angeles USA 21 Toronto Waterfront Canada 22 Hamburg Germany 23 Prague Czech Republic 24 Milan Italy 25 Turin Italy 26 Daegu South Korea 27 Nagano Japan 28 San Diego, Rock ’n’ Roll USA 29 Pyongyang Korea 30 Istanbul Turkey 31 Ottawa Canada 32 Venice Italy 33 Vienna Austria 34 Mumbai India 35 Sapporo, Hokkaido Japan 36 Dusseldorf Germany 37 Carpi, Ferrari Maranello Italy 38 Honolulu USA
Time 2:19:08 2:20:52 2:21:18 2:22:43 2:22:47 2:23:02 2:23:17 2:23:31 2:23:43 2:23:47 2:23:49 2:23:58 2:24:08 2:24:21 2:24:22 2:24:31 2:25:05 2:25:16 2:25:59 2:26:08 2:26:12 2:26:31 2:26:50 2:27:115 2:27:19 2:27:395 2:27:47 2:27:55 2:28:12 2:28:15 2:28:32 2:28:37 2:28:38 2:28:50 2:28:52 2:29:03 2:29:13 2:29:22
Year 2007 2006 (2:20) 2009 2005* 2013 2013 2005 2007 2013 2008 2003 2013 2007 2013 2013 2005 2011 2013* 2009* 2013 2013 2006 2013 (2:25¼) 2010 2012 2013 2002 2012 2009* 2013 2013 2011 2011 2013 2009 2013 2000 2006
City Country 39 Tokyo Japan 40 Eindhoven Netherlands, Benelux 41 Dublin Great Britain & Ireland 42 Twin Cities USA Minneapolis/St. Paul 43 Cologne Germany 44 Nairobi Kenya 45 Florence Italy 46 Phoenix, Rock ’n’ Roll USA 47 Reims France 48 Padova Sant’Antonio Italy
49 Taipei International Taiwan, Southeast Asia 50 Dalian China Treviso Italy Zurich Switzerland Ljubljana Slovenia, Balkans Zhengzhou China Eugene USA Torreon, La Laguna Mexico Duluth, Grandma’s USA Lisbon Portugal Kosice Slovakia Pittsburgh USA Columbus Ohio USA Sacramento, California USA International Austin USA Baltimore USA Marrakech Morocco Brisbane, Gold Coast Australia Omsk, Siberian International ex-USSR, Russia Seville Spain Nashville, Country Music USA San Sebastian, Donostia Spain Cleveland USA Chuncheon Korea La Rochelle France Melbourne Australia Newport, Ocean State USA Mazatlan, Pacifico Mexico Belgrade Serbia, Balkans Stockholm Sweden, Scandinavia
Time 2:29:22 2:29:30 2:29:49 2:30:16
Year 2013 2013 2011 2004 (2:29¼)
2:30:18 2:30:41 2:31:16 2:31:20 2:31:23 2:31:26 2:31:31 2:31:35 2:31:47 2:31:47 2:31:48 2:31:48 2:31:57 2:32:03 2:32:04 2:32:11 2:32:14 2:32:19 2:32:34 2:32:38
2009 2013 (2:24¼) 2005 2010 (2:29¾) 2011 2012 2010 1999 2011 2013 (2:29¾) 2013 (2:31) 2013* 1983 2009 (2:27¼) 2005 (2:30) 1997 2013 1990 (2:31¼) 2005 (2:31) 2013
2:32:57 2:32:59 2:33:09 2:33:12 2:33:18 2:33:25 2:33:27 2:33:37 2:33:44 2:33:44 2:33:50 2:33:51 2:34:02 2:34:02 2:34:075 2:34:11
2005 2013 1997 (2:31¼) 2013 2002 2013 2008 1995 2000* 2002 2012 2013 2002 2005 2001 1991
City Mainz Monte Carlo Las Vegas Singapore Cannes-Nice, Alps Maritimes Madrid Dallas, White Rock Linz Lyon Puteaux, Hauts de Seine Santiago Enschede Barcelona Hannover Toronto, Shoppers Drug Mart Montreal Debno Budapest Warsaw Porto Trieste Szeged, International Friendship Athens Classic Krakow, Cracovia Echternach, Zwei Lander Thessaloniki, Alexander the Great Lausanne Valencia Hong Kong Uzhgorod Poznan Kassel Odense, H.C. Andersen Munich, Median Munster Salt Lake City Sydney, Australian Chemnitz, Karl Marx Stadt
Country Germany Monaco/France USA Singapore, Southeast Asia France
Time 2:34:15 2:34:19 2:34:21 2:34:22 2:34:22
Year 2013 2002 2009 (2:31¾) 2010 2013
Spain USA Austria France France Chile Netherlands, Benelux Spain Germany Canada
2:34:34 2:34:41 2:34:44 2:34:47 2:35:005 2:35:01 2:35:02 2:35:04 2:35:04 2:35:075
2013 (2:31½) 2008 2013 (2:33¾) 2001 1996 2013 (2:35) 2002 2002 1999 1995
Canada Poland Hungary Poland Portugal Italy Hungary
2:35:11 2:35:13 2:35:36 2:35:39 2:35:39 2:35:52 2:35:57
1986 2004 1987 2012 2013 2006 1990
Greece Poland Luxembourg, Benelux Greece
2:36:08 2:36:18 2:36:27 2:36:40
2012 2012 1997 2011
Switzerland Spain China ex-USSR, Ukraine Poland Germany Denmark, Scandinavia Germany Germany USA Australia Germany
2:36:46 2:36:50 2:36:53 2:37:03 2:37:03 2:37:10 2:37:18 2:37:29 2:37:49 2:38:00 2:38:104 2:38:125
2004 (2:35) 2004 2006 1991# 2013 2013 2005 1993 (2:35½) 2013 2009 (2:32) 1987 1987*
City Country Sao Paulo Brazil Long Beach USA Macau China Bonn Germany Antwerp Belgium, Benelux Mont St. Michel France Essen, Rund um Germany den Baldeneysee San Francisco USA Guadalajara Mexico St Petersburg, ex-USSR, Russia White Nights Miami old version USA Lille France Taranaki to New Plymouth, New Zealand
Mountain to Surf Auckland, various New Zealand Egna, Sudtirol Italy Dresden Germany Porto Alegre Brazil Casablanca Morocco Reggio Emilia Italy Hitachinaka, Katsuta Japan Hartford USA Mexico City Mexico Vancouver Canada Caen, Liberte France Philadelphia USA Detroit USA Tiberias Israel Copenhagen Denmark, Scandinavia Karlsruhe, Baden Germany Bucharest since restart Romania Maassluis, Westland Netherlands, Benelux Sama de Langreo Spain Asturias Valle d.Nalón Italy Ferrara San Luis Potosi, Mexico Tangamanga Huntsville, Rocket City USA Moscow Peace ex-USSR, Russia Miami since restart USA
Time 2:38:14 2:38:17 2:38:25 2:38:28 2:38:33 2:38:34 2:38:34
Year 2013 2004 1999 2007 1999 2007 2008
2:38:38 2:38:45 2:38:45
1987 2010 (2:31¼) 2012
2:38:47 2:38:52 2:39:04
1985 1995 1994
2:39:20 2:39:22 2:39:26 2:39:27 2:39:27 2:39:30 2:39:31 2:39:40 2:39:41 2:39:42 2:39:44 2:39:45 2:39:46 2:39:51 2:39:51 2:39:58 2:40:045 2:40:07 2:40:07 2:40:20
1985 2003 2008 2003 2013 2009 2003 2004 2013 (2:28) 2011 2004 1986 2008 2012 (2:40½) 2013 2013 2013 1997 1997 2001
2:40:24
2009 (2:31½)
2:40:24 2:40:24 2:40:25
1987 2001 2008
City Country Calvia, Majorca Spain Wroclaw Poland Helsinki Finland, Scandinavia Culiacan Mexico Otawara Japan Richmond USA Rio de Janeiro Brazil Buenos Aries Argentina Edinburgh Scotland, Great Britain San Antonio USA Duisburg, Rhein-Ruhr Germany Durban South Africa Oslo Norway, Scandinavia Brescia Italy Palermo Italy Jacksonville Beach USA Verona Italy Auckland restarted New Zealand Memphis, St Jude USA Sofia Bulgaria, Balkans Portland USA Washington, Marines USA Napa Valley USA Sydney Australia
Buffalo to Niagara Falls USA & Canada International Bangkok Thailand St Louis USA Carmel, Big Sur USA International Seattle USA Culver City, USA Western Hemisphere Avenue of the Giants USA Port Elizabeth South Africa Atlanta USA
Time 2:40:38 2:40:38 2:40:38 2:40:40 2:40:44 2:40:51 2:40:52 2:40:52 2:41:06 2:41:09 2:41:19 2:41:31 2:41:335 2:41:38 2:41:44 2:42:29 2:42:335 2:42:51 2:43:10 2:43:20 2:43:28 2:43:50 2:44:01 2:44:09 2:36:214 2:45:33
Year 1993 2005 1994 2010 2007 2003 2013 2013 2013 2010 1989 1992 1989 2008 2004 2013 2013 2000 2010 2005 1991 1994 2013 2005, 1998 2005
2:46:26 2:47:32 2:47:43
2012 1997 1996
2:48:06 2:49:22
1984 1978
2:51:51 2:52:19 2:57:53
1987 1990 2003
Key ( ) time adjusted for sea level 2:xx:xx5 average for five marathons 2:xx:xx4 average for four marathons * includes several questionable performances # possibly faster in the 1980s Short courses are rounded up where distance short is known
Marathon Medal Table—Women Based on gold for sub-2:25:00 (3 points), silver for sub-2:32:30 (2 points), and bronze for sub-2:40:00 (1 point). Minimum of five consecutive years required for a marathon to qualify.
Rk.
Country
Gold
Silver
Bronze
Pts.
1
USA
4
8
16
44
2
Germany
2
3
10
22
3
Italy
0
8
3
19
4
Japan
3
3
1
16
5
China
1
4
2
13
6
France & Monaco
1
1
8
13
7
Benelux, Netherlands, Belgium & Luxembourg
1
2
3
10
8
Korea
1
2
1
8
9
Iberia, Spain & Portugal
0
1
6
8
10
Canada
0
2
3
7
11
Alps, Switzerland & Austria
0
2
2
6
12
Great Britain & Ireland
1
1
0
5
13
Mexico
0
1
3
5
14
Czech Republic & Slovakia
0
1
2
4
15j
Poland
0
0
4
4
15j
Australia & New Zealand
0
0
4
4
17
United Arab Emirates
1
0
0
3
18j
Southeast Asia, Thailand, Malaysia, Taiwan & Singapore
0
1
1
3
18j
Balkans, Slovenia, Serbia, Bulgaria, Macedonia, etc.
0
1
1
3
20j
Scandinavia, Norway, Sweden, Finland & Denmark
0
0
3
3
20j
Russia & ex-USSR countries
0
0
3
3
22j
Turkey
0
1
0
2
22j
India
0
1
0
2
24j
Hungary
0
0
2
2
24j
Morocco
0
0
2
2
Key j joint score
The United States takes the lion’s share of the medals although in terms of regions is third behind the Orient, with Europe far ahead. Germany is the strongest European nation, followed by Italy, which has many high-quality marathons, eight silvers, and surprisingly no golds, although Rome is only five seconds off. Farther west in the Mediterranean on the Iberian Peninsula there is a lack of top marathons. Japan has three top-class marathons and three second-class ones without much backup. China and to a lesser extent Korea do likewise. Vast Russia, even with countries from the ex-USSR, only just makes the table, having only three bronzes. No South American or Australasian countries make the table, the latter surprising given their history of high-quality female marathoners. There are no medals at all for South Africa. The great marathon powerhouse that is Kenya is likely to make the medal table and be in the top 20 in a few years.
Male and female event marathon-bests comparison The men’s and women’s marathon trends by event show a few differences. The Japanese men led the way in the 1980s, whilst the women lagged behind their European and North American competitors. However, in China the women are relatively faster than the men, especially for the Shanghai Marathon. Many of the men’s and women’s marathons in Japan are raced separately so there is no direct comparison.
The men’s continental marathon trends are all in ascendancy, which is not the case for the European and North American ladies. Within most marathons there is the same trend regardless of sex. Curiously, there was a significant downward trend for women in the Barcelona Marathon whilst the men were improving. Conversely, the men are in decline at the Twin Cities and Napa Valley Marathons whilst the women are holding steady. After 2002, the women at Amsterdam and Rotterdam slowed whilst the men improved, although the women’s plots have now recovered. Other marathons in the Benelux such as Eindhoven, Brussels, and Utrecht have relatively slow women’s finishing times compared with the men.
The marathon trends during the initial boom show women had a relatively lower standard compared with the men, considering the differential of modern-day performance. That hardly features anymore for new marathons. In that respect there is now effective equality between the sexes. Some marathons in the rest of Asia have the most difference in standard between the men and women, the Tiberias Marathon on the Sea of Galilee a good example. That is not surprising given the dominance of men in the Middle East. Marathons in Africa and Oceania show that the men and women parallel each other. Some South American marathons have relatively stronger male finishing times compared with the women.
The men’s marathon list has many more entries than the women’s list. That is because the men have much greater strength in depth. Women taking time out
to have families and lack of competition both help keep their elite fields smaller than the men’s. There is also a much smaller percentage of female African winners compared with the men. East African men dominate the winner’s podiums, and given an equal chance the women would surely do the same. In recent times Kenya wins the most prize money, followed by Ethiopia and the USA. However, the Kenyan men collect far more than their women by proportion, which is not the norm.
The entries in the men’s (see the May/June 2013 issue of M&B) and women’s medal tables are fairly similar in positioning. The combined medal table (not shown) has the USA far ahead, followed by Italy, with Germany very close behind. Japan with France are next, the Benelux sixth and Iberia, Great Britain and Ireland, and China as the next group.
Men’s and women’s event bests Marathons less than 4:40:00 combining the six-year average winning times of men and women for the same year: City 1 Berlin 2 London 3 Chicago 4 Dubai 5j Paris 5j Rotterdam 7 Frankfurt 8 Amsterdam 9 Seoul 10 Houston 11 Boston 12 New York 13 Rome 14 Beijing 15 Hamburg 16 Prague 17 Toronto Waterfront 18 Xiamen 19 Daegu 20 Milan 21 Eindhoven 22 Shanghai 23 Turin
Country Germany Great Britain & Ireland USA United Arab Emirates France Benelux Germany Benelux Korea USA USA USA Italy China Germany Czech Republic Canada China Korea Italy Benelux China Italy
Time 4:26:00 4:26:18 4:27:45 4:28:16½ 4:29:07 4:29:07 4:29:29 4:30:32 4:32:05 4:33:03 4:33:07 4:33:24½ 4:33:55 4:34:05 4:34:29 4:34:48 4:35:22 4:35:46 4:36:035 4:36:10 4:36:42 4:36:56 4:37:14
Year 2013 2013 2013 2013 2013 2013 2013 2013 2010 2013 2003 2008 2011 2005* 2008 2013 2013 2013* 2013 2010 2013 2012* 2012
City 24 Vienna 25 Los Angeles 26 Tokyo 27 San Diego 28 Ottawa 29 Venice 30 Dusseldorf 31 Dublin 32 Istanbul
Country Austria USA Japan USA Canada Italy Germany Ireland Turkey
Time 4:37:14 4:37:23 4:38:04 4:38:12 4:38:45 4:38:46 4:38:57 4:39:05 4:39:28
Year 2013 2013 2013 2012 2013 2011 2013 2012 2012
Key j joint score 2:xx:xx5 average for five marathons * includes several questionable performances
The order of Berlin, London, and Chicago does not tell the whole story. Chicago is ever so slightly “at altitude,” and in terms of performance, it actually matches London. Also accounting for the altitude, Nairobi is as good a standard fifth. Dubai in fourth is on course to beat Chicago. Paris and especially Rotterdam are both likely to improve as in the latter women relatively lag behind the
ad
men. Second-tier European marathons on the rise include Frankfurt, Amsterdam, Prague, Vienna, Eindhoven, Dusseldorf, and possibly Turin, plus Rome. Dublin makes the list but slumped in 2013. Houston makes the top 10, overtaking New York and Boston, which are slipping down the list. Like Houston, Toronto Waterfront and Los Angeles are ascending. So many big marathons are seeing faster times that the order is likely to significantly change in the next few years. Hamburg, Milan, and Beijing are in decline. Separate elite men’s and women’s races mean that the only Japanese race to make the list is Tokyo. That is likely to be the most improved marathon in the immediate future. Combining the fastest elite men’s marathon—Fukuoka—and fastest women’s—Osaka—they peak in 2009 and would be good for seventh. Mumbai is just over 4:40:00 and just missed out. Nagano, Cologne, Twin Cities, Reims, Florence, and Pyongyang have been close to breaking that time. * * * The marathon helps build the kudos of big cities. Every year another chapter is written as cities vie for the fastest runners. A reason for competition between marathons is that the fastest marathoners cannot run full-out more than two or three times a year so the elite are wooed, usually by appearance fees and prize money. The men’s article stressed that marathons are buying fast times. Increasingly, there are more elite female runners from Kenya and Ethiopia to go around, making third-rate marathons won in fast times. The general rise in winner’s times helps create more significant marathons. Such growth means that some of the most prestigious by virtue of their course can no longer sport the fastest times. No one marathon completely dominates, but if we had to name the recent bests purely on winning times, London wins the women’s race, Berlin the men’s, and Chicago is the main opposition from across the Atlantic. These races have enticed recent world-record holders, and that makes the small difference that makes all the difference between being number one and an also-ran.
The big U.S. marathons are being trumped by Houston, and the Canadians are charging. Berlin is beginning to seriously worry about Frankfurt, whilst Dubai threatens to steal everyone’s thunder. Is it time that Amsterdam or Rotterdam engage overdrive? And as ever, the biggies in the Orient are threatening. The trends show there are no ever-present winners, just runners and cities that lead the way when it is their opportunity to be number one.
This article originally appeared in Marathon & Beyond, Vol. 18, No. 3 (2014).
← Browse the full M&B ArchiveMore like this
1,000+ stories from 19 years of Marathon & Beyond
The complete archive of the legendary long-distance journal — digitized and free to read.
