

Trends in Elite-Level Marathon Performances
THE PIONEERING exercise physiologist Archibald Hill concluded long ago (1924) that one could learn much about the limits of athletic performance by studying the results of the performers themselves, particularly during competition. Athletes train very hard to perform well on the given day, and mentally they are prepared to deliver their best effort. Sport competition follows fairly specific rules and generates accurate data in the form of race results. Because the marathon is contested over road courses rather than a track and requires more than two hours to complete, external influences such as adverse weather and/or course terrain can significantly slow performance. When we study the very fastest marathon performances over a long period of time, however, these external influences cancel out, leaving elite athleticism as the primary contributor to performance excellence. When we study large numbers of these performances, our analyses yield substantially reliable conclusions.
A 20-YEAR STUDY
For more than 20 years, I have been compiling top-level marathon performances worldwide. This study started as a side project when I was preparing an in-depth appendix for a book written to chronicle the history of the marathon (The Marathon Footrace, 1979). The compiling has continued ever since, as one aspect of a project to provide useful information to enhance my coaching perspective with elite-level athletes.
The activity has also been essential in my role as marathon results compiler and analyst for the annual statistical book produced by the Association of Track and Field Statisticians (Athletics, 1996). Also, as statistician (i.e., results compiler) for the Association of International Marathons (AIMS), I have often found that I can apply conclusions derived from the study of top-level performances to questions concerning global trends in marathon participation. The database is essentially a complete record of almost 20,000 entries for men, and nearly 18,000 for women. Maintaining such a large database is challenging, but at the same time the work is valuable for generating meaningful answers to interesting questions.
The performance limits I’ve used for marathon results collection have been sub-2:20:00 for men and sub-2:55:00 for women. How did I select these limits? When I started this record keeping, for the men, 2:20:00 was a “barrier” that was nearly as mystical as the sub-4:00-minute mile. After the 2:20:00 barrier was broken, it became fascinating to keep a list of the superstars who had done so. I’ve just continued to keep track every year since. For the women, initially, I just kept results that were faster than 3:00:00, as that time was also a challenging barrier. However, the limit for women has been tightened to 2:55:00 because that gives a yearly sample size similar to that of the men.
For the past 15 years, about 12 minutes have separated the men’s fastest time and 2:20:00. In contrast, for the women, about 31 minutes has separated their annual fastest time and 2:55:00. What explains this much larger time difference for the women than for the men? One probable factor is that marathon racing for women is a newer sport than it is for the men and has fewer participants. Another factor is the existence of sociocultural restrictions in many parts of the world that limit opportunities for women to live an athlete’s lifestyle. Thus, the gene pool is smaller, and the depth of competition is less.
This larger time differential for the women has important performance implications, however. For whatever reason, an elite woman marathoner can “have a bad day” in her race and run a slower time than expected, yet she will not fall back nearly as far in the database rankings as a man who had a time-equivalent misfortune. This is not to say that women can be less serious about their training for excellence, but a mistake for them is not so costly. Conversely, a woman’s especially fine performance will be more easily noticed.
ANALYSIS OF THE MEN’S PERFORMANCES
Table 1 summarizes top-level marathon activity by men, starting with the first bona fide sub-2:20:00 performance on a 42,195-meter course by Jim Peters at Chiswick back in June of 1953. This table ends with 19,997 sub-2:20:00 performances recorded as of the end of 1996. Summarized for each year are the following:
- the number of such fast performances
- the number of nations represented
- the top six nations contributing to these performances
- the percent contribution of these six nations to the total top-level marathon activity.
Let me make some of the more obvious conclusions from these data.
Since 1961, Japan has been among the top six nations every year, and in first place for 19 of these 36 years, most recently since 1992. Japan’s 2,288 sub-2:20:00 performances represent 11.4 percent of the total. Although not shown directly on this table, Japan’s top-level talent has produced well-known excellence in world competition. At the Olympic level, for example, during this period Japanese athletes have earned a bronze (in ’64), two silvers (in ’68 and ’92), and two fourth places (in ’84 and ’88).
Over this same 36 year period (1991–1996), however, the United States has actually accumulated the most sub-2:20:00 performances—2,309 or 11.5
TABLE 1 — Nations With the Most Sub-2:20:00 Marathon Performances by Men
| Year | # Performances | # Nations | #1 | #2 | #3 | #4 | #5 | #6 | % of Total |
|---|---|---|---|---|---|---|---|---|---|
| 1953 | 4 | 1 | GBR 4 | ||||||
| 1954 | 1 | 1 | GBR 1 | ||||||
| 1955 | 0 | 0 | |||||||
| 1956 | 4 | 1 | FIN 4 | ||||||
| 1957 | 1 | 1 | URS 1 | ||||||
| 1958 | 2 | 2 | URS 1 | CHN 1 | |||||
| 1959 | 2 | 2 | TCH 1 | URS 1 | |||||
| 1960 | 12 | 6 | GBR 5 | URS 2 | NZL 2 | ETH 1 | MAR 1 | FIN 1 | 100% |
| 1961 | 3 | 3 | NZL 1 | JPN 1 | TCH 1 | 100% | |||
| 1962 | 11 | 5 | JPN 7 | URS 1 | PRK 1 | USA 1 | TCH 1 | 100% | |
| 1963 | 22 | 7 | JPN 10 | GBR 4 | USA 2 | URS 2 | NZL 2 | BEL 1 | 95.5% |
| 1964 | 47 | 10 | JPN 23 | GBR 8 | ETH 4 | NZL 3 | BEL 2 | FIN 2 | 89.4% |
| 1965 | 44 | 7 | JPN 28 | GBR 8 | URS 3 | USA 2 | BEL 1 | CHN 1 | 97.7% |
| 1966 | 80 | 11 | JPN 45 | GDR 7 | NZL 5 | GBR 3 | USA 2 | CAN 2 | 80.0% |
| 1967 | 58 | 10 | JPN 27 | GBR 8 | NZL 5 | GDR 6 | URS 5 | USA 2 | 91.4% |
| 1968 | 93 | 20 | JPN 37 | GBR 11 | URS 8 | HUN 5 | FIN 5 | KOR 3 | 74.2% |
| 1969 | 82 | 16 | JPN 25 | GBR 16 | ETH 5 | CAN 4 | MEX 4 | NZL 4 | 70.7% |
| 1970 | 102 | 19 | JPN 30 | GBR 26 | NZL 7 | URS 7 | AUS 5 | GDR 3 | 76.5% |
| 1971 | 140 | 25 | JPN 23 | GBR 31 | URS 15 | FIN 9 | NZL 8 | AUS 7 | 66.4% |
| 1972 | 156 | 26 | GBR 26 | URS 17 | JPN 16 | USA 12 | FIN 12 | FRG 10 | 59.6% |
| 1973 | 165 | 20 | URS 31 | JPN 26 | GBR 26 | USA 12 | FIN 12 | FRG 9 | 70.3% |
| 1974 | 209 | 24 | JPN 40 | URS 27 | GBR 25 | USA 22 | GDR 18 | FIN 10 | 67.9% |
| 1975 | 274 | 30 | JPN 47 | USA 40 | URS 36 | GBR 34 | GDR 20 | NZL 13 | 69.3% |
| 1976 | 260 | 32 | USA 37 | JPN 35 | URS 32 | ITA 17 | GBR 16 | GDR 14 | 58.1% |
| 1977 | 286 | 33 | USA 45 | JPN 37 | GBR 36 | URS 34 | FIN 16 | GDR 15 | 64.0% |
| 1978 | 448 | 34 | USA 87 | JPN 51 | GBR 49 | URS 46 | POL 25 | FRG 15 | 60.9% |
| 1979 | 580 | 38 | USA 163 | URS 71 | JPN 64 | GBR 55 | RSA 24 | FRA 19 | 68.3% |
| 1980 | 754 | 42 | USA 187 | URS 105 | GBR 69 | JPN 60 | FRA 28 | FRG 25 | 62.9% |
| 1981 | 731 | 42 | USA 193 | GBR 83 | JPN 60 | URS 50 | RSA 33 | ITA 27 | 61.0% |
| 1982 | 834 | 51 | USA 191 | GBR 79 | URS 71 | JPN 63 | ITA 30 | RSA 26 | 55.2% |
| 1983 | 1134 | 48 | USA 267 | GBR 137 | JPN 88 | URS 63 | ITA 49 | BEL 36 | 56.5% |
| 1984 | 1101 | 57 | USA 165 | GBR 116 | JPN 102 | URS 86 | ITA 43 | POL 42 | 50.3% |
percent of the total. And its Olympic level excellence has been comparable to Japan’s: a gold (in ’72), a silver (in ’76), and two fourth places (in ’72, ’76). However, the growth pattern of U.S. top-level marathoners has been quite different from that of Japan. During the 1960s, when Japan was leading the world in marathon performance, the United States was far behind, along with other nations. Then, beginning in 1972, when Frank Shorter earned his Munich gold medal, U.S. marathon racing activity increased. Notice in Table 1 that 1976 launched a “golden decade” of amazing U.S. dominance in terms of the sheer numbers of top-level marathon performances delivered. Then, starting with 1985, a year after the Los Angeles Olympic Games, a new trend of steadily decreasing U.S. performances began—and continues to this day. In the early 1980s, U.S. marathoners routinely ran 100 to 200 sub-2:20:00 performances; now that number has dwindled to a low of 40 such performances in 1996 (see Figure 1).
| Year | # Performances | # Nations | #1 | #2 | #3 | #4 | #5 | #6 | % of Total |
|---|---|---|---|---|---|---|---|---|---|
| 1985 | 996 | 54 | USA 99 | JPN 100 | URS 97 | GBR 96 | POL 46 | BEL 40 | 48.0% |
| 1986 | 1024 | 49 | USA 114 | JPN 103 | POL 81 | GBR 73 | URS 69 | HUN 39 | 46.7% |
| 1987 | 1026 | 56 | JPN 116 | USA 96 | URS 91 | GBR 66 | POL 55 | ITA 42 | 45.4% |
| 1988 | 980 | 53 | URS 94 | JPN 90 | USA 65 | GBR 62 | POL 54 | ITA 53 | 42.6% |
| 1989 | 943 | 53 | URS 110 | JPN 83 | POL 75 | USA 63 | GBR 52 | ITA 38 | 44.5% |
| 1990 | 954 | 57 | JPN 104 | URS 82 | USA 75 | POL 65 | FRA 41 | GBR 38 | 42.5% |
| 1991 | 1070 | 56 | URS 140 | JPN 122 | USA 93 | POL 63 | GBR 46 | RSA 39 | 47.0% |
| 1992 | 1048 | 60 | JPN 113 | URS 92 | USA 64 | POL 58 | ITA 41 | GBR 37 | 38.6% |
| 1993 | 1097 | 62 | JPN 124 | RUS 92 | POL 61 | USA 57 | MEX 52 | RSA 50 | 39.7% |
| 1994 | 1145 | 64 | JPN 128 | RUS 98 | KEN 79 | POL 69 | USA 53 | ETH 53 | 41.9% |
| 1995 | 1034 | 68 | JPN 123 | KEN 86 | RUS 82 | MEX 62 | USA 59 | POL 52 | 44.9% |
| 1996 | 1040 | 66 | JPN 137 | KEN 109 | RUS 75 | POL 61 | ETH 51 | ITA 47 | 46.2% |
| TOTAL | 19,997 |
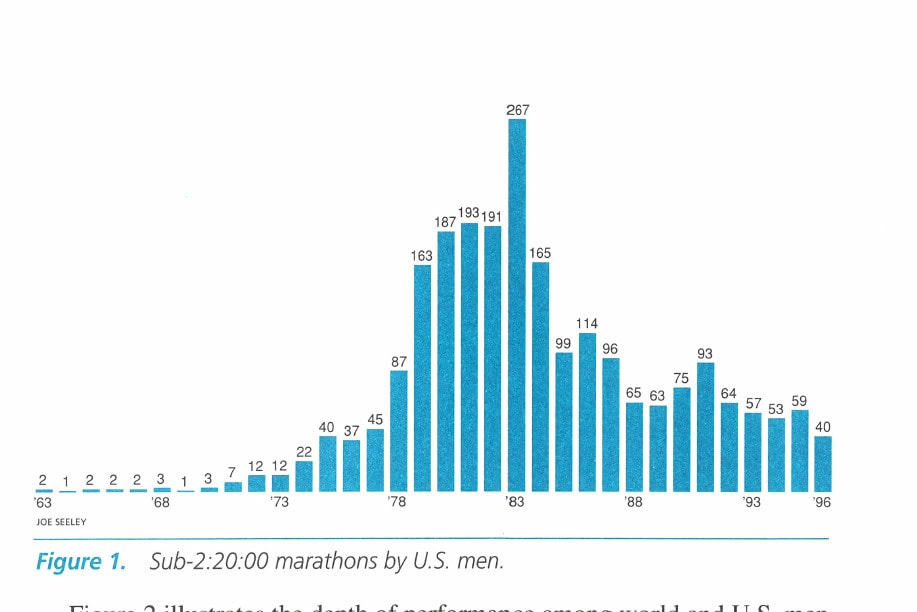
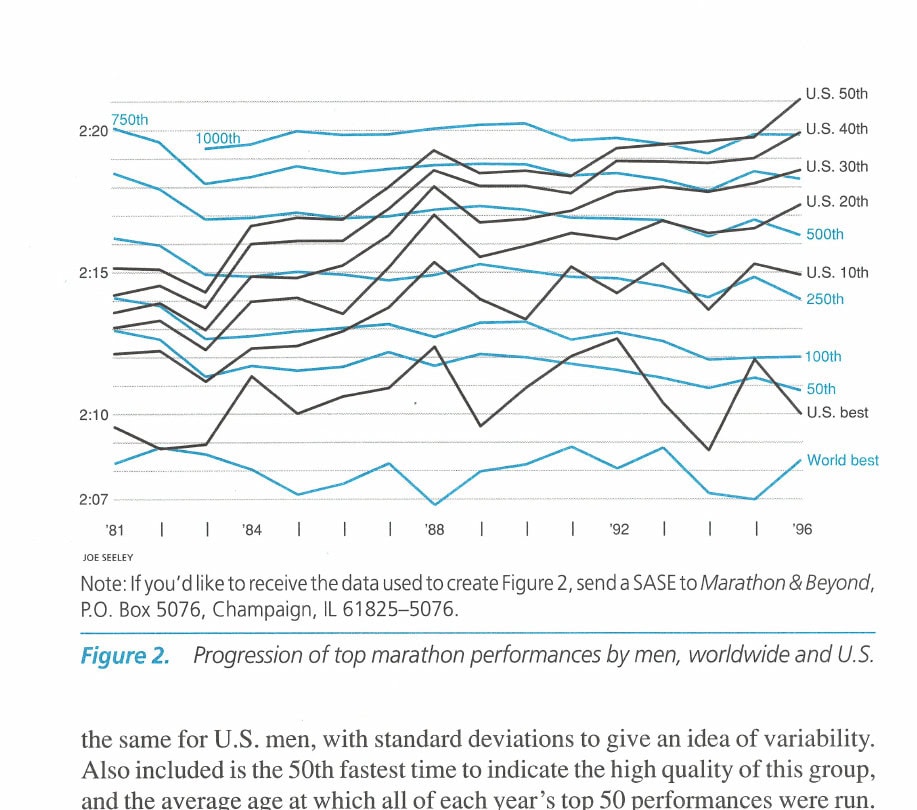
Figure 2 illustrates the depth of performance among world and U.S. men marathon runners. The black lines show the 1st, 10th, 20th, 30th, 40th, and 50th fastest performance for U.S. men during the past 16 years, 1981 through 1996. The lines in color in Figure 2 chart the world scene and presents the annual 1st, 50th, 100th, 250th, 500th, 750th, and 1,000th fastest performances over this same period. For both groups, the fastest performance each year over this period hasn’t changed much, hovering around 2:08:00 for the world and 2:10:00 for the United States. However, when the entire population of U.S. and world performances are compared, we see some interesting differences. For example, the 50th fastest world performance has improved by over 2 minutes, from 2:12:59 in 1981 to 2:10:52 in 1996, while the 50th fastest U.S. performance has slowed from 2:14:22 in 1983 to 2:21:08 in 1996.
What is the explanation for this recent but continuing fall-off in U.S. performance quality? Is the U.S. athlete population changing in such a way that the athletes are at an increasing disadvantage to perform well? Or are the characteristics of the competing world population changing? I’ll attempt to answer these questions shortly.
Population Demographics
Can we learn anything about the trend of declining U.S. performance from studying population demographics? Age as an influencing variable can indeed be considered, because athlete birth date and performance race date comprise part of each performance entry. Table 2 summarizes the fastest, youngest, and oldest men among the top 50 world performances each year and Table 3 does the same for U.S. men, with standard deviations to give an idea of variability. Also included is the 50th fastest time to indicate the high quality of this group, and the average age at which all of each year’s top 50 performances were run.
There are some similarities in age among the U.S. and world men. The very fastest athletes each year average 27 to 28 years of age. And the average age for the runners of the top 50 performances each year is 28 to 29 years. However, among the youngest and oldest runners, the U.S. runners differ from the world at large. Each year, the youngest male marathoner among the top 50 performances worldwide continues to be 20 to 21 years of age. But the youngest U.S. athlete among the top 50 U.S. performances is getting older—in recent years, 23 to 24 years of age.
Two possibilities might explain this trend: There are fewer talented high school and college level male distance runners, and fewer of these runners are opting for marathon racing. If the second possibility is in fact occurring, then we would expect to see an increasingly aging U.S. men’s marathon-running population, as the current marathoners continue to compete.
Although no data are available to address the first possibility, the data presented in Tables 2 and 3 shows that the U.S. men’s marathon population is indeed aging. Comparing the top 50 U.S. and world marathon performances over the past 16 years, we see that the mean age of the oldest U.S. runner is
Table 2: Age Characteristics of the Top 50 World Men Marathon Performances
| Year | 50th Fastest Time | Mean Age | Standard Deviation | Fastest | Youngest | Oldest |
|---|---|---|---|---|---|---|
| 1981 | 2:12:59 | 27.9 | 3.16 | 24 – de Castella (AUS) | 22 – Rinde (USA) | 36 – Mora (COL) |
| 1982 | 2:12:40 | 28.3 | 3.22 | 23 – Salazar (USA) | 22 – Ikangaa (TAN) | 36 – Marczak (POL) |
| 1983 | 2:11:21 | 28.0 | 3.48 | 26 – de Castella (AUS) | 21 – Jorgensen (DEN) | 37 – Stahl (SWE) |
| 1984 | 2:11:44 | 27.4 | 3.92 | 29 – Jones (GBR) | 20 – Mekonnen (ETH) | 37 – Lopes (POR) |
| 1985 | 2:11:34 | 27.7 | 3.77 | 38 – Lopes (POR) | 20 – Mtolo (RSA) | 38 – Lopes (POR) |
| 1986 | 2:11:42 | 27.4 | 3.67 | 28 – Kodama (JPN) | 20 – Dinsamo (ETH) | 34 – Spedding (GBR) |
| 1987 | 2:12:13 | 27.7 | 3.52 | 27 – Nakayama (JPN) | 21 – Naali (TAN) | 34 – Spedding (GBR) |
| 1988 | 2:11:44 | 28.4 | 3.84 | 22 – Dinsamo (TAN) | 20 – Cruz (MEX) | 39 – Campbell (NZL) |
| 1989 | 2:12:09 | 28.3 | 3.79 | 29 – Ikangaa (TAN) | 20 – Zeleka (ETH) | 36 – Nyambui (KEN) |
| 1990 | 2:12:02 | 29.0 | 3.94 | 28 – Moneghetti (AUS) | 21 – Kim (KOR) | 41 – Campbell (NZL) |
| 1991 | 2:11:48 | 28.1 | 3.06 | 23 – Morishita (JPN) | 22 – Tadi (ETH) | 35 – Peter (GDR) |
| 1992 | 2:11:35 | 27.7 | 4.10 | 25 – Tsebe (RSA) | 19 – Negere (ETH) | 37 – Jones (GBR) |
| 1993 | 2:11:18 | 27.6 | 3.65 | 28 – Ceron (MEX) | 20 – Kebede (ETH) | 35 – O’Reilly (IRL) |
| 1994 | 2:10:57 | 27.8 | 3.57 | 22 – Ndeti (KEN) | 21 – Cho (KOR) | 34 – Taniguchi (JPN) |
| 1995 | 2:11:19 | 29.3 | 3.96 | 31 – Lelei (KEN) | 21 – Wainaina (KEN) | 37 – Martin (GBR) |
| 1996 | 2:10:52 | 29.0 | 3.71 | 33 – Fiz (ESP) | 21 – Tangus (TAN) | 39 – Salah (DJI) |
| MEAN | 2:11:45 | 28.1 | 3.65 | 27.3 +/- 4.18 S.D. | 20.7 +/- 0.85 S.D. | 36.6 +/- 1.94 S.D. |
nearly two years older than that of the world men. Thus, the notion that U.S. male runners “make a career” out of marathoning instead of “giving it their all” in youth may have some validity. However, these U.S. runners may find it increasingly difficult to succeed because of the trend illustrated on the mean top-50 performance lists that shows that male runners at the world level are not slowing down, while the U.S. men’s times are slowing substantially.
An additional demographic point of interest is that only 2 of the 16 youngest male marathoners worldwide are Caucasian white athletes, and only 4 of the 16 oldest male marathoners worldwide are not. The sociocultural aspects of this distribution could be debated at length, so I’ll leave them for readers to explore. This sociocultural issue is complex, as it involves the gamut of athletes from rigidly-controlled societies, whose governments have a high priority for sport, to athletes from more free societies that have made sport a viable means of earning an acceptable living for many years as a kind of sports business.
| Year | 50th Fastest Time | Mean Age | Standard Deviation | Fastest | Youngest | Oldest |
|---|---|---|---|---|---|---|
| 1981 | 2:15:13 | 27.0 | 3.16 | 23 – Salazar | 21 – Ortiz | 33 – Rodgers |
| 1982 | 2:15:10 | 27.4 | 3.20 | 25 – Beardsley | 20 – Law | 34 – Rodgers |
| 1983 | 2:14:42 | 26.7 | 3.04 | 27 – Meyer | 20 – Law | 35 – Rodgers |
| 1984 | 2:16:22 | 27.1 | 3.70 | 26 – Martin | 22 – Eyestone | 40 – Brown |
| 1985 | 2:16:59 | 28.7 | 3.37 | 31 – Coppess | 23 – Olds | 37 – Rodgers |
| 1986 | 2:16:55 | 28.7 | 3.60 | 30 – Donakowski | 22 – Brownsberger | 38 – Rodgers |
| 1987 | 2:18:03 | 29.7 | 3.58 | 29 – Froelich | 23 – Gompers | 39 – Rodgers |
| 1988 | 2:19:21 | 29.6 | 3.88 | 27 – Conover | 24 – Gompers | 40 – Rodgers |
| 1989 | 2:18:33 | 31.1 | 4.17 | 31 – Martin | 23 – General | 38 – Judson |
| 1990 | 2:18:38 | 30.1 | 3.97 | 29 – Eyestone | 24 – Hudson | 40 – Judson |
| 1991 | 2:18:26 | 31.1 | 4.15 | 33 – Martin | 24 – Hudson | 40 – Judson |
| 1992 | 2:19:25 | 30.4 | 3.84 | 29 – Spence | 23 – Evans | 40 – Kurtis |
| 1993 | 2:19:33 | 32.1 | 4.88 | 27 – Lawson | 22 – Kieser | 41 – Kurtis |
| 1994 | 2:19:40 | 31.5 | 4.38 | 27 – Kempainen | 23 – Dudley | 42 – Kurtis |
| 1995 | 2:19:48 | 30.5 | 3.55 | 28 – Kempainen | 24 – Collins | 38 – Plasencia |
| 1996 | 2:21:08 | 30.6 | 4.09 | 30 – Lawson | 24 – Dimoff | 40 – Hawthorne |
| MEAN | 2:17:47 | 29.5 | 3.79 | 28.3 +/- 2.43 S.D. | 22.6 +/- 1.32 S.D. | 38.4 +/- 2.47 S.D. |
Analysis of the Women’s Performances
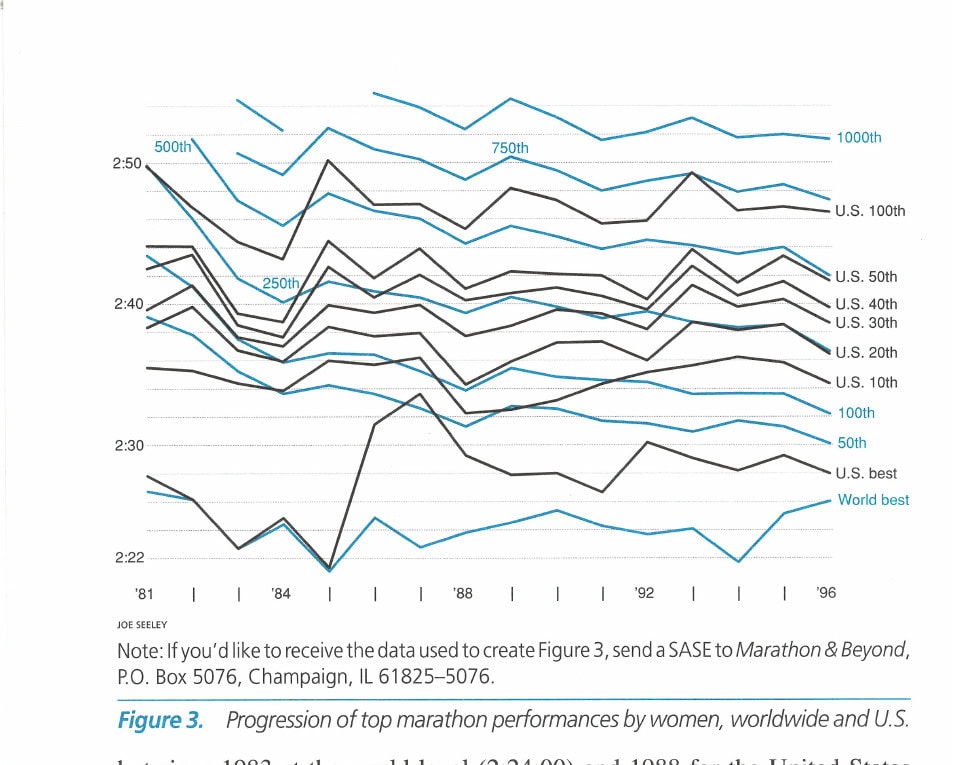
Studying the performance dynamics of women marathoners is equally fascinating, although a much more recent story, dating back only to 1984 regarding Olympic participation. The data show similarities to and differences from the men. Table 4 and Figure 3 (page 38–40) present the same kind of information as Table 1 and Figure 2 did. Recall that the sub-2:55:00 cutoff for performances gives a yearly sample size similar to that of the men.
Table 4 takes us back to the very first sub-2:55:00 performance, by Adrienne Beames of Australia at Werribee in August of 1971, followed in December by the U.S.’s Cheryl Bridges at the Culver City Marathon in December. The dramatic rise in women’s participation in 1978 and 1979 was helped substantially by the creation of the worldwide Avon International Running Circuit, a six-year program of international marathons and shorter road races intended by the Avon Corporation to focus attention on its products for women, promote a healthy lifestyle among women, and assist the cause of adding a marathon for women on the Olympic schedule.
The Avon circuit director was none other than 1967 Boston Marathon entrant Kathrine Switzer, whose attempted ejection from that race by a chauvinistic race official caused worldwide attention to the inequities regarding women’s sport participation. Starting with Atlanta in 1978, well-attended annual Avon-sponsored international marathons moved around the world, from Germany to London to Ottawa to San Francisco, and finally, in 1983, to what would be the Los Angeles Olympic marathon course.
As Table 4 shows, the United States has been the unquestioned dominant force in the sheer numbers of participants at the top level. Of the 17,720 sub-2:55:00 performances in the women’s database, 4,458 have been run by U.S. athletes, which is 25 percent of the total. One probable reason for this large percentage is that socioculturally a more receptive attitude regarding women’s athletic competition has prevailed in the United States since the 1970s, more so even than in Europe, where athleticism was widely practiced at the highest levels. During the 1980s, Great Britain was a major force in women’s marathon participation, with the Soviet Union not far behind. During the 1990s, with the breakup of the Soviet Union, Russia has remained a consistent major player, with Japan close behind.
As with the men, the number of countries contributing top-level women marathoners is increasing, which steadily decreases the relative contribution of the top six most active nations in the total number of performances. Joan Benoit’s Olympic gold medal in 1984 doubtless provided a year’s-long impetus for other U.S. women to continue their devotion to top-level marathoning. This movement has been enhanced not only by the increasing financial incentives among women’s prize-money arrangements at mixed races, but also by the increasing numbers of women’s-only marathons at the highest level, especially in Japan.
Another likely contributing factor to the continued high level of marathon activity by women relates to the more limited track opportunities for women distance runners than for men until very recently. The 10,000-meter event was added to the Olympic schedule only in 1988, the 5,000-meter event in 1996. Thus, at the top level, the marathon was the distance of choice for women.
Notice in Table 4 the interesting cyclic variation in the number of U.S. women performances over the four-year Olympic period, evident since 1980. The post-Olympic year has far fewer performances than the year previous (for example, 156 in 1985, 199 in 1989, and 171 in 1993), with a steady increase over the next few years until the year following the Games. This cyclicity isn’t seen either with men’s (U.S. or world) or world women’s performances.
| Year | # Performances | # Nations | #1 | #2 | #3 | #4 | #5 | #6 | % of Total |
|---|---|---|---|---|---|---|---|---|---|
| 1971 | 2 | 2 | AUS 1 | USA 1 | 100% | ||||
| 1972 | 0 | 0 | |||||||
| 1973 | 2 | 1 | USA 2 | 100% | |||||
| 1974 | 9 | 3 | USA 4 | FRG 3 | FRA 2 | 100% | |||
| 1975 | 18 | 5 | USA 11 | FRG 4 | HOL 1 | HUN 1 | FRA 1 | 100% | |
| 1976 | 39 | 10 | USA 21 | FRG 6 | HOL 2 | HUN 2 | ITA 1 | GBR 1 | 84.6% |
| 1977 | 45 | 8 | USA 34 | FRG 4 | FRA 2 | ITA 1 | NZL 1 | NOR 1 | 95.6% |
| 1978 | 91 | 15 | USA 57 | FRG 9 | CAN 5 | GBR 5 | BRA 2 | AUS 2 | 87.9% |
| 1979 | 209 | 16 | USA 122 | GBR 18 | CAN 17 | FRG 11 | NOR 9 | FRA 6 | 87.6% |
| 1980 | 310 | 22 | USA 147 | GBR 30 | FRG 21 | FRA 15 | URS 14 | NZL 12 | 77.1% |
| 1981 | 448 | 29 | USA 180 | GBR 39 | URS 36 | CAN 32 | FRG 27 | NZL 20 | 74.6% |
| 1982 | 694 | 35 | USA 269 | GBR 69 | URS 56 | FRG 40 | NZL 32 | CAN 23 | 70.5% |
| 1983 | 1038 | 41 | USA 385 | GBR 101 | URS 72 | FRG 63 | CAN 35 | AUS 27 | 65.8% |
| 1984 | 1203 | 46 | USA 403 | URS 117 | GBR 92 | FRG 59 | CAN 49 | ITA 39 | 63.1% |
| 1985 | 894 | 37 | USA 156 | GBR 104 | URS 89 | FRG 59 | ITA 42 | JPN 42 | 55.0% |
| 1986 | 1003 | 40 | USA 229 | URS 113 | FRG 76 | GBR 69 | JPN 41 | ITA 35 | 56.1% |
| 1987 | 1092 | 46 | USA 305 | URS 90 | GBR 67 | FRG 62 | JPN 46 | CHN 41 | 56.0% |
| 1988 | 1203 | 55 | USA 314 | URS 117 | FRG 70 | GBR 69 | ITA 59 | JPN 54 | 56.8% |
| 1989 | 1031 | 51 | USA 199 | URS 94 | JPN 80 | GBR 79 | FRG 61 | ITA 50 | 54.6% |
| 1990 | 1121 | 56 | USA 203 | URS 127 | JPN 110 | GBR 60 | FRG 54 | POL 41 | 53.1% |
| 1991 | 1268 | 53 | USA 272 | URS 168 | JPN 109 | GBR 72 | FRA 57 | GER 53 | 57.6% |
| 1992 | 1201 | 62 | USA 222 | JPN 118 | RUS 111 | GER 68 | GBR 60 | FRA 43 | 51.8% |
| 1993 | 1126 | 57 | USA 171 | RUS 129 | JPN 107 | FRA 53 | CHN 51 | GER 47 | 49.6% |
| 1994 | 1205 | 60 | USA 222 | RUS 141 | JPN 120 | GBR 54 | GER 45 | FRA 45 | 52.0% |
| 1995 | 1214 | 65 | USA 296 | RUS 126 | JPN 123 | GER 50 | POL 44 | FRA 42 | 56.1% |
| 1996 | 1254 | 60 | USA 233 | JPN 188 | RUS 127 | GER 49 | POL 44 | FRA 44 | 54.6% |
| Total | 17,720 |
Population Demographics
As with the men, much can be learned about the top U.S. and world women marathoners by assessing the entire database. As Figure 3 shows, the fastest annual women’s time varies widely, among both the world and U.S. databases,
but since 1983 at the world level (2:24:00) and 1988 for the United States (2:28:00), the times have been fairly stable.
Age demographics for elite women marathoners are shown in Table 5 for the world and Table 6 for the United States. The mean age for the fastest time for the world top 50 women’s performances is 28.3 years, and the mean age for the single fastest performance each year is 27.5 years. These ages are similar to the men. However, for the U.S. women, the average age of their annual top 50 performances is slightly older at 29.2, similar to the average age of the single athlete running the fastest performance each year.
For the U.S. women, as with the U.S. men, among both the very youngest and the very oldest top-level performances, we see that the athletes are getting older. The mean age of the youngest top women marathoners worldwide is remaining constant (between 19 and 20 years of age), but the average age of the youngest top-level U.S. women marathoner is steadily getting older (from 19 to 20 years of age in the early 1980s to 24 to 25 in the early 1990s). Also, notice in Tables 5 and 6 that the oldest U.S. women are about two years younger than the oldest women at the world level. This is the opposite of what we observed for the men. The mean age for the oldest U.S. men running the 50 fastest performances is older than the world mean.
| Year | 50th Fastest Time | Mean Age | Standard Deviation | Fastest | Youngest | Oldest |
|---|---|---|---|---|---|---|
| 1981 | 2:39:08 | 26.4 | 4.55 | 24 – Roe (NZL) | 19 – Bush (CAY) | 43 – Smith (GBR) |
| 1982 | 2:37:51 | 27.8 | 5.31 | 25 – Benoit (USA) | 18 – Masuda (JPN) | 44 – Smith (GBR) |
| 1983 | 2:35:16 | 27.2 | 5.92 | 25 – Benoit (USA) | 19 – Masuda (JPN) | 45 – Smith (GBR) |
| 1984 | 2:33:40 | 27.3 | 5.10 | 28 – Kristiansen (NOR) | 20 – Masuda (JPN) | 46 – Smith (GBR) |
| 1985 | 2:34:16 | 27.5 | 3.98 | 29 – Kristiansen (NOR) | 20 – Weinhold (GDR) | 35 – Teske (FRG) |
| 1986 | 2:33:39 | 30.2 | 4.43 | 32 – Waitz (NOR) | 23 – Martins (GDR) | 44 – Palm (SWE) |
| 1987 | 2:32:38 | 29.4 | 5.26 | 31 – Kristiansen (NOR) | 19 – Zhong (CHN) | 42 – Welch (GBR) |
| 1988 | 2:31:21 | 29.5 | 5.15 | 27 – Martin (AUS) | 20 – O’Brien (USA) | 43 – Welch (GBR) |
| 1989 | 2:32:47 | 29.6 | 5.08 | 33 – Kristiansen (NOR) | 20 – Mun (PRK) | 47 – Palm (SWE) |
| 1990 | 2:32:26 | 29.5 | 4.24 | 31 – Mota (POR) | 20 – Hyodo (JPN) | 38 – Beurskens (NED) |
| 1991 | 2:31:44 | 29.4 | 3.85 | 32 – Panfil (POL) | 23 – Markova (RUS) | 38 – Smith (USA) |
| 1992 | 2:31:33 | 27.2 | 4.04 | 23 – Markova (RUS) | 20 – Kokamo (JPN) | 39 – Smith (USA) |
| 1993 | 2:30:58 | 26.6 | 5.19 | 20 – Wang (CHN) | 19 – Gu (CHN) | 41 – Beurskens (NED) |
| 1994 | 2:31:45 | 28.1 | 4.56 | 28 – Pippig (GER) | 20 – Yamazoe (JPN) | 42 – Beurskens (NED) |
| 1995 | 2:31:20 | 28.5 | 4.01 | 29 – Pippig (GER) | 20 – Kim (PRK) | 38 – Pozdnyakova (RUS) |
| 1996 | 2:30:08 | 28.5 | 4.37 | 34 – Dorre (GER) | 20 – Chickahira (JPN) | 37 – Kokowska (POL) |
| MEAN | 2:33:09 | 28.3 | 4.71 | 27.5 +/- 4.70 S.D. | 20.0 +/- 1.27 S.D. | 41.4 +/- 3.41 S.D. |
| Year | 50th Fastest Time | Mean Age | Standard Deviation | Fastest | Youngest | Oldest |
|---|---|---|---|---|---|---|
| 1981 | 2:44:08 | 26.2 | 4.79 | 28 – Catalano | 16 – Erickson | 39 – Dalrymple |
| 1982 | 2:44:06 | 26.9 | 4.70 | 25 – Benoit | 20 – Dunn | 40 – Dalrymple |
| 1983 | 2:39:21 | 25.6 | 4.50 | 25 – Benoit | 19 – Spangler | 36 – Binder |
| 1984 | 2:38:44 | 25.6 | 3.95 | 27 – Benoit | 16 – Schiro | 39 – Madeira |
| 1985 | 2:44:28 | 27.7 | 3.67 | 28 – Samuelson | 20 – Erickson | 37 – Binder |
| 1986 | 2:41:50 | 28.6 | 3.82 | 31 – Raunig | 20 – Erickson | 37 – Buch |
| 1987 | 2:43:55 | 28.7 | 4.68 | 32 – Roben | 20 – O’Brien | 41 – Ladage |
| 1988 | 2:41:05 | 28.9 | 3.58 | 26 – Weidenbach | 20 – O’Brien | 35 – Smith |
| 1989 | 2:42:18 | 29.4 | 3.57 | 31 – Jones | 21 – O’Brien | 41 – Binder |
| 1990 | 2:42:07 | 30.5 | 4.18 | 37 – Smith | 23 – Lamena | 43 – Binder |
| 1991 | 2:42:00 | 31.0 | 4.23 | 32 – Jones | 23 – O’Brien | 44 – Binder |
| 1992 | 2:40:19 | 31.7 | 3.78 | 31 – Klecker | 24 – O’Brien | 41 – Gilbert |
| 1993 | 2:43:51 | 30.9 | 3.39 | 27 – Johnston | 24 – Legacki | 38 – Welzel |
| 1994 | 2:41:30 | 31.3 | 3.23 | 30 – Appell | 25 – Legacki | 38 – Raunig |
| 1995 | 2:43:23 | 31.0 | 3.10 | 32 – Appell | 24 – Gausman | 40 – Thurau |
| 1996 | 2:41:38 | 32.4 | 3.41 | 33 – Appell | 26 – Peterson | 41 – Thurau |
| MEAN | 2:42:10 | 29.2 | 3.91 | 29.7 +/- 3.20 S.D. | 21.3 +/- 2.89 S.D. | 39.4 +/- 2.39 S.D. |
Regarding sociocultural demographics, as with the men, very few of the youngest world women marathoners are Caucasian whites, while the oldest are primarily Caucasian whites, mainly European residents.
REDUCED MARATHON PARTICIPATION BY U.S. MEN
Athletes from an increasingly large number of nations have started to achieve top-level success in the marathon. This dilutes the percentage of U.S. performances when compared to the total, but it does not explain the steady decline in total numbers of U.S. marathon performances faster than the 2:20:00 standard. The explanation is simply fewer athletes competing. The reasons for this are many. Let’s look at several of the contributing factors.
Recruiting Foreign Distance Runners
First (and this is a contentious issue) is the ongoing recruitment of substantial numbers of collegiate distance runners from other nations, which deprives U.S. runners of a chance to develop their expertise at any distance, including the marathon. One reason coaches give for such recruiting practices is that if one college goes after the world gene pool, then others must as well to remain competitive. Another reason coaches offer for overlooking the local talent is that athletes emerging from today’s high schools are not as fit as athletes from around the world. One viable explanation for this may be that their high school coaches do not want to “burn out” their runners in high school. Instead, the coaches bring the runners along so they’ll love the sport, remain injury-free, and develop a long-term love for running that will extend into and beyond college. For U.S. athletes to be passed by in favor of foreign ones who are more fit, and then to have college funds go into developing these foreign runners—who will eventually go on to earn medals for their home nations—is a fairly unique bit of global American generosity, which the rest of the world appreciates but does not return in equal measure. The result is diminished development of U.S. distance-running talent in exchange for subsidizing talented athletes worldwide. This leads to a decline in the number of U.S. men distance runners in general, not solely marathon runners. The “problem” is not the marathon as an event, but the decreased number of scholarships that colleges could provide to talented U.S. distance runners.
Disappearing Role Models and the Attractiveness of Other Events
Disappearing role models and the attractiveness of other events have also been influential in decreasing marathon participation among men. A brief recall of history is appropriate. The first-, fourth-, and ninth-place excellence of Frank Shorter, Kenny Moore, and Jack Bacheler, respectively, in the 1972 Olympics was a big stimulus to American runners, who were thrilled to see the U.S. go head to head with the then-excellent-but-much-smaller marathoning world. In fact, their marathon performances represented the best showing by any nation since 1908, when Americans went first, third, and fourth (Johnny Hayes, Joe Forshaw, and Alton Welton, respectively). The 1973 Boston Marathon first and second place performances by Jon Anderson and Tom Fleming, respectively, continued this momentum and set the stage for sports media to give worldwide coverage to Bill Rodgers’s American record at Boston in 1975. No particular vision or well-thought-out plan just starting to bear fruit had been created by the national sports governing body (at that time, the Amateur Athletic Union) to explain this marathon excellence. (Nor is there a well-thought-out plan for
developing distance runners today either). During this era, we saw good athletes maturing and enjoying what they were doing and being motivated by their own individualism to be better than ever before in their chosen sport.
An Olympics in nearby Canada in 1976 provided a forum for American athletes to draw even more attention to the marathon. Frank Shorter took the silver medal, and Don Kardong placed fourth, missing the bronze by a scant three seconds. Rodgers was in that race as well, but the effects of an injury relegated him to 40th place. Later that fall, thanks to the genius of Fred Lebow, the New York City Marathon opted to “go international,” with a much-publicized race through the boroughs. Rodgers and Shorter were both healthy, went head-to-head, and placed first and second, in that order. American runners saw again that this sport (and particularly, winning at this sport!) could be great fun. Indeed, distance runners flocked to the event, and U.S. runners did have fun, for 10 golden years.
This period included the Moscow boycott, with no Olympic opportunity to shine. By 1984 and the next Olympics, the huge population of marathon-oriented distance runners suddenly realized that only three among their ranks could race in Los Angeles. Thus, for many a return to a track focus became a preferred option, and they sought team places in the steeplechase, 5K, and 10K.
In addition to Olympic-level sport, the International Amateur Athletic Federation responded to aggressive leadership by its new president, Primo Nebiolo, and created a series of World Championships that provided many distance running options: cross country and summertime track initially, ekidens and half marathons later. These events were intended to ensure control by the world governing body over major sporting opportunities and thus compete with the rapidly-increasing numbers of road races springing up worldwide. The chance to race more frequently (after all, racing is the fun part of being a distance runner!) and the larger number of event opportunities for earning money to support an athlete lifestyle has tended to dilute the focus on the marathon.
Loss of Fast U.S. Courses
A third contributing factor to explain the reduced appearance of U.S. men marathoners on the top-performance lists is a gradual loss in the number of dependably fast courses in the United States for runners to achieve fast times. The top-50 performance lists have increasingly been dominated by places like Rotterdam, Kyongju, London, Berlin, Fukuoka, and Tokyo for the men, and London, Berlin, Tokyo, Osaka, and Nagoya for the women. These courses have almost laboratory-like running conditions: flat courses, consistently chilly weather, cloudy skies, excellent competition, and pace-making athletes in front. Minimal travel stress helps Asians do well in Asia, and Europeans and Africans do well in Europe. U.S. runners face time-zone adaptation in either direction, and as a rule they are less able to cope with the hassle of different languages and cultures, and less familiar living conditions than those at home.
A related factor involves a trend for recent top-level U.S. championships to be awarded to courses less favorable to fast times (for example, Jersey City, Columbus, and Charlotte as compared to Niagara Falls and Eugene). Selecting fast U.S. courses to increase the chance of placing U.S. runners at the top of world performance lists is (perhaps logically) a lower priority to the national governing body than obtaining a high-dollar value in services and prize money provided by the race sponsor to produce a worthy event. But international race directors review lists of fastest marathoners in their quest for “suitable” invitees to their events.
Risk of Injury and Burnout
Finally, there is the substantially increased risk of injury and burnout required in marathon training to achieve success at the top level. When Frank Shorter won his four back-to-back races in Fukuoka in the 1970s, his 2:10+ efforts were as much as 2 minutes ahead of second place. There was much less depth of competition in those days. Now, it isn’t unusual in a marathon to see three athletes enter the stadium track together and sprint over the final 400 meters to determine the order of finish in 2:09 or faster. Thus, the intensity of training—and racing—necessary to be a viable finisher has greatly increased. The increased sophistication on a global level of athlete management by agents has also saturated marathon races with much larger quality fields than in Shorter’s day. These athletes, particularly from countries with economic standards vastly lower than those in the United States, are entirely willing to endure far more hardship—arduous training, living on another continent, and being away from their families and culture, for example—because the financial reward from race earnings has purchasing power back home that is almost incomprehensible to a U.S. athlete.
Conclusions
When we examine the fastest performances worldwide against an unchanging standard (2:20:00 for men and 2:55:00 for women), several trends emerge:
- Worldwide, more men and women are participating in the marathon (and from more nations) than ever before.
- Over the past 10 years the total number of performances within the selected standards has been relatively stable, with just over 1,000 performances each year.
- The annual fastest individual performances by U.S. and world men and women have not been quickening. While we see an increase in depth among the top-level world women’s performances, the men’s performances have remained fairly stable.
- In both quantity and quality, there has been a substantial reduction in total top-level U.S. men’s marathon activity. Among U.S. athletes, neither men nor women are running marathons at ages as young as previously.
- As a group, U.S. women continue to account for more sub-2:55:00 performances per year than any other nation, well ahead of runner-ups Russia and Japan.
- Among the men, Japanese athletes contribute the most sub-2:20:00 performances, followed by Kenya and Russia.
Marathon running is now almost a global passion. Never before have there been so many participants at all levels of ability, in every corner of the world, from Kathmandu to Kansas City, from Capetown to Canberra. This marathoning activity supports a myriad of industries that produce gadgets, personal agents, energy foods, touring and travel packages, and much more. The marathon environment is ever-changing in its complexity and diversity, making its future as bright as it is unpredictable.
This article originally appeared in Marathon & Beyond, Vol. 1, No. 3 (1997).
← Browse the full M&B ArchiveMore like this
1,000+ stories from 19 years of Marathon & Beyond
The complete archive of the legendary long-distance journal — digitized and free to read.
