

Countdown to the First Sub-2:00:00
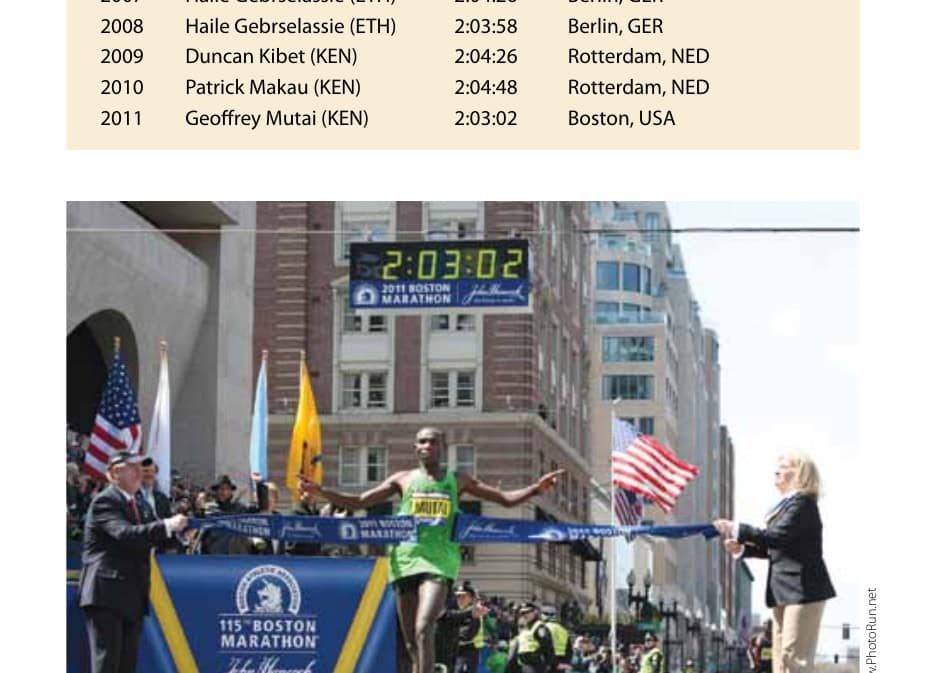
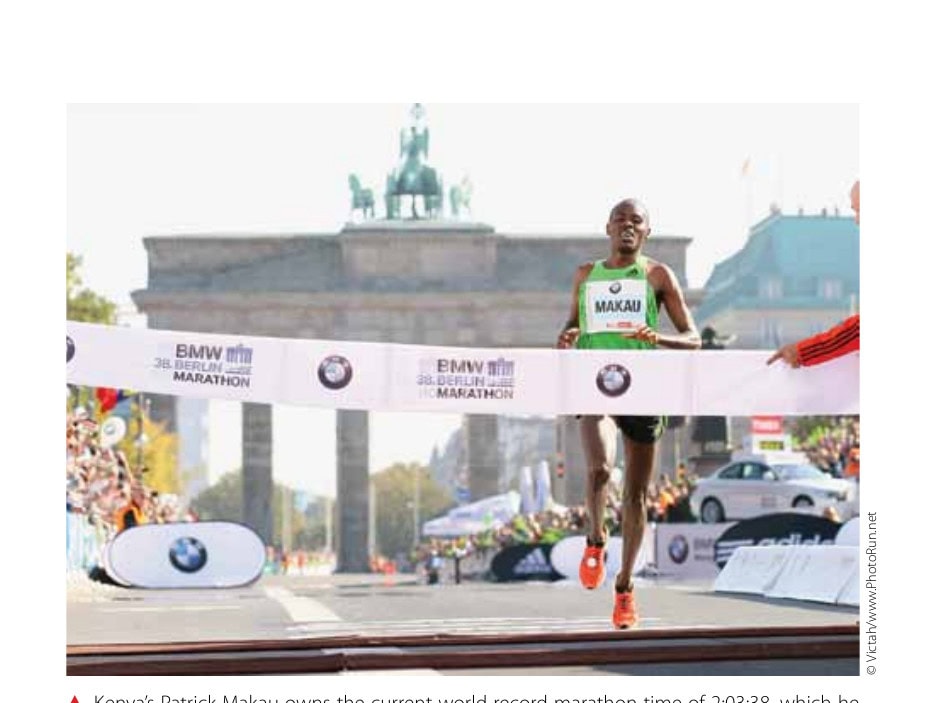
The year 2011 was an incredible one for marathon performances. Along with a new world record (2:03:38 by Patrick Makau, September 25, Berlin) every one of the World Marathon Major course records was broken (London, Boston, Berlin, Chicago, and New York). Such impressive finishing times over the past 12 months have focused the world’s attention on the marathon much as the mile entranced the world of sport more than 60 years ago. With seven performances under the 2:05 mark in 2011, the once-deemed-impossible barrier of a human covering the 26.2-mile (42.195K) distance in less than two hours now seems not only feasible but expected. Achieving this feat requires running a seemingly inconceivable pace of 4:35 per mile (2:51 per kilometer), or viewed more practically to some, running back-to-back 68-second splits for 105 1/2 consecutive laps around a 400-meter track. For comparison’s sake, Geoffrey Mutai’s world-leading effort in Boston last spring equates to an average of 4:42 per mile (2:55 per kilometer) and 70-second lap splits.
Humans seem particularly drawn to clean, round numbers, and the fact that we are now less than four minutes away from someone surpassing the two-hour barrier has led, not surprisingly, to a great deal of recent attention on the marathon distance. Achieving such an act is a topic of curiosity for many, and thus the intrigue of predicting or projecting future running records is not new. Numerous articles have been published on the subject. Various statistical models have been developed, but the best approach has been to analyze running performance over time with asymptotic functions, although linear and polynomial models are also used. With enough data points, these “time versus year” plots yield curves that can be used to predict world records as well as ultimate physiological performances. Liu and Schutz (1998) analyzed marathon world records and best performances per year across several running distances and models (linear and nonlinear) and it seemed that an exponential-decay model relating running time and historical year was the most valid deterministic model for predicting performances.
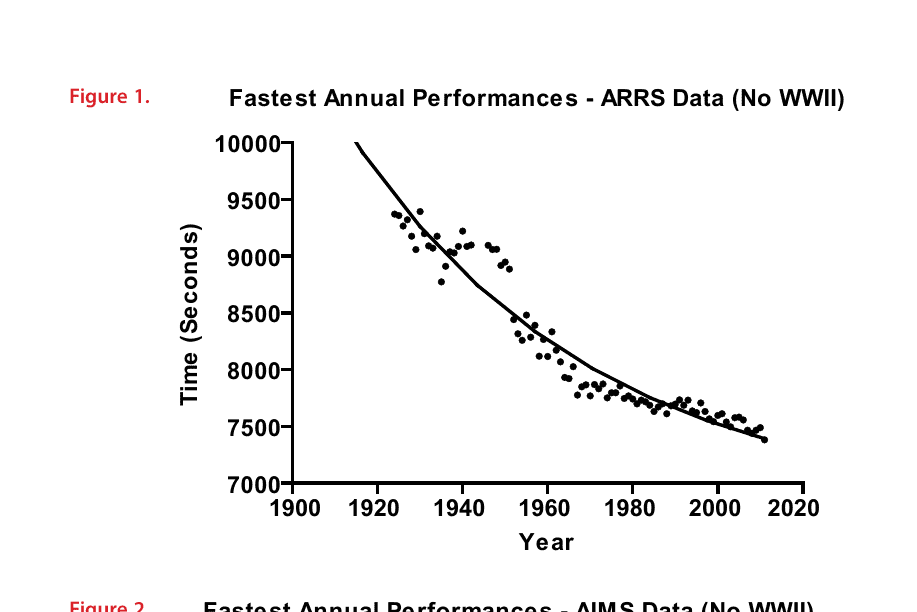
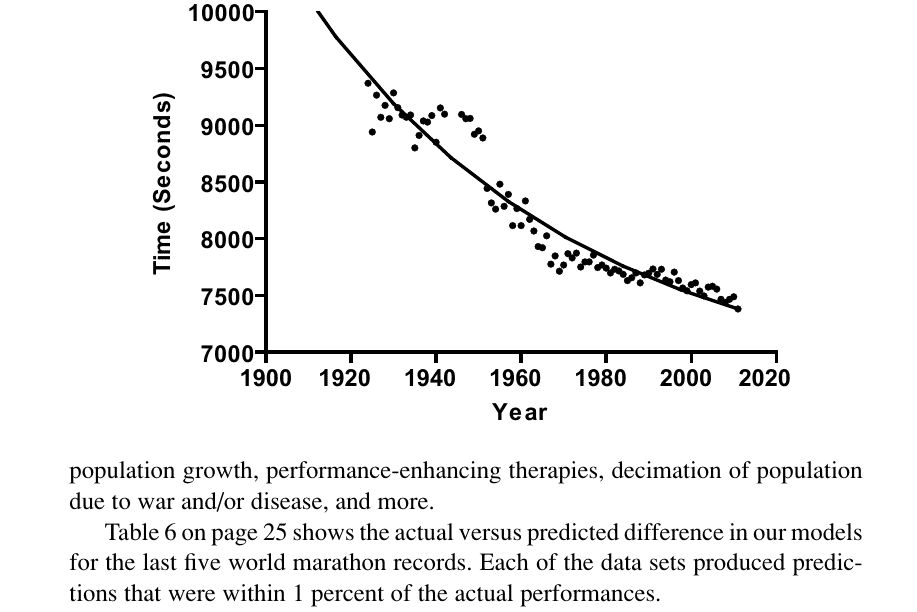
To predict the date of the first sub-two-hour marathon, we compiled the fastest annual performance (FAP) times from 1924 to 2011 as well as the world-record progression (WR) during this same period (see tables 1, 2, and 3 on pages 29 to 35 of this article). A one-phase exponential decay model was used to fit the data, enabling us to predict both the year when the two-hour barrier will be broken as well as the fastest theoretical marathon time possible.
We analyzed three different marathon data sets. Two (tables 2 and 3) are slightly varying lists of the fastest annual marathon times (the World War II years of 1943–45 were removed from statistical analysis) and include data from David Martin, former statistician for the Association of International Marathons and Distance Races, or AIMS, as well as data from the Association of Road Racing Statistics, or ARRS. We chose 1924 as the starting point because this was the year the official IAAF marathon distance of 42.195K was initially run at the Olympic level and has continued for all subsequent Games. The Martin and ARRS marathon time lists differ primarily in several performances before WWII, as there is some debate regarding the validity of early marathon times due to a lack of information regarding course-distance accuracy. Decision-making regarding the fastest marathon times on early marathon courses has always been arbitrary because the science of course measurement was only beginning to be defined. We therefore chose to analyze both FAP lists along with the WR list to see how the different data sets affected the prediction (see table 4 and figures 1, 2, and 3). The following equation was used:
Y= (Y0 – Plateau)*exp(-K*X) + Plateau
Where Y0 = the initial condition, Plateau is the theoretical fastest possible time, K is the rate constant, and X is performance time.
Using the WR data provides the best fit (r²=0.95, where the closer r² is to 1 the better the model is at predicting a trend), but the FAP lists fit nearly as well (r²=0.93 for ARRS and 0.92 for Martin). This was not surprising, as world-record progression data yields smaller error since record times continually decrease, making them more amenable to decay-function fitting. However, since these are best-of-the-best samples and discontinuous, the validity of the model may be affected when used for predictions. For example, it took 10 years for the 1988 record to be broken, but the 1998 record was broken three times in the next six years. Theoretically, the WR could be broken multiple times in a year or once in 20 years without the trend line itself being incorrect. However, for a sub-2:00 prediction, we are not interested so much in the trend line as a single point. With year-over-year data, the only error is on the y-axis as one sample must occur each year. So in accordance with Liu and Schutz (1998), we conclude that the FAP model predictions are slightly superior to those using WR data.
Table 4. Prediction models for marathon performance
| FAP (Martin data) | FAP (ARRS data) | WR Data | |
|---|---|---|---|
| Year of first sub-2 hour performance: | 2029 | 2032 | 2035 |
| Fastest theoretical time possible: | 1:50:54 | 1:52:56 | 1:54:15 |
| Best Fit Values | |||
| Y0 | 2.123E+16 | 7.338E+17 | 4.316e+017 |
| K | 0.01542 | 0.01726 | 0.01708 |
| Plateau (sec) | 6654 | 6776 | 6855 |
| r² | 0.92 | 0.93 | 0.95 |
Our models forecast the first sub-2:00 marathon performance occurring as early as 2029 and as late as 2035 with ultimate performances of 1:50:54 (Martin data), 1:52:56 (ARRS data), and 1:54:15 (WR data). Our results are similar to those performed by Peronnet and Thibault (1989), where a sub-2:00 marathon by the year 2028 and an ultimate performance of 1:48:25 were predicted using physiologically based models. Morton (1983) used time-versus-year data with exponential-decay models to predict running performances up to 5,000 meters that were later extrapolated to the marathon distance by Peronnet and Thibault (1989) to yield a projected ultimate performance time of 1:52:14. By comparison, Liu and Schutz’s (1998) exponential models predicted an ultimate performance of 2:00:43, never breaking through the two-hour barrier. Liu and Schutz also predicted a 2010 best time of 2:06:07 (actual was 2:04:48) and a 2050 best time of 2:02:39 (predicted to occur in 2012 to 2014 in our models). The underestimations of Liu’s models are likely due to the fact that more data is currently available (their predictions were made in 1998); thus, our models indicate that recent results have expanded the window of possible marathon times downward by about eight to 10 minutes. A summary of our results compared with past predictions is shown in table 5.
All three models predict modest yearly improvements in times, ranging from about seven seconds per year (WR data) to about 10 seconds per year (FAP—Martin data). This is what we would expect to see as the limits of human performance approach. So although we are merely 3 1/2 minutes away from the two-hour mark, our models predict it will take at least 17 years to get there. It should be noted that many new variables, plus the changing influence of existing ones, can potentially affect the rate of change, and as one can imagine, the number of contributing variables are extremely wide ranging—changing shoe technology,
population growth, performance-enhancing therapies, decimation of population due to war and/or disease, and more.
Table 6 on page 25 shows the actual versus predicted difference in our models for the last five world marathon records. Each of the data sets produced predictions that were within 1 percent of the actual performances.
With an idea of when the first marathon run under two hours may occur, it is also interesting to try to forecast who is likely to do it. Looking at the strongest marathon nations as assessed by the top 100 athletes and performances (by
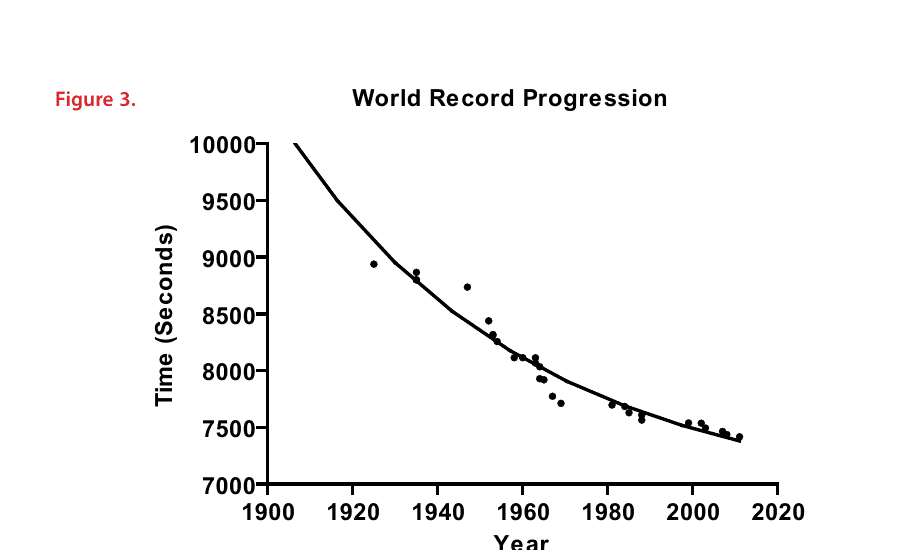
Table 5. Performance predictions, past and present
| Author (publication year) | Performance Projections |
|---|---|
| Lloyd (1966) | 2:02:00 (2000) |
| Ryder et al. (1976) | 1:53:13 (2028) |
| Rumball (1970) | 1:37:30 (ultimate) |
| Morton (1983) | 1:52:14 (ultimate) |
| Peronnet & Thibault (1989) | 1:59:36 (2028), 1:48:25 (ultimate) |
| Joyner (1991) | 1:57:58 (ultimate) |
| Liu & Schutz (1998) | 2:06:07 (2010), 2:02:39 (2050), 2:00:33 (ultimate) |
| Nevill & Whyte (2005) | 2:03:38 (ultimate) |
| Present models | |
| Martin FAP | 2:00:06 (2028), 1:57:27 (2050), 1:50:54 (ultimate) |
| ARRS FAP | 2:00:33 (2028), 1:57:31 (2050), 1:52:56 (ultimate) |
| WR | 2:00:50 (2028), 1:58:11 (2050), 1:54:15 (ultimate) |
assigning a point value of 100 to 1 and summing the totals for each nation) over the last five years can provide hints as to which country is most likely to lay claim to the first runner able to topple the barrier. The results, shown in table 7 on page 25, should not be a surprise to anyone following the sport—African nations, most notably Kenya, currently possess world dominance in the marathon, with one of the most impressive statistics being that 96 percent of the top 20 fastest yearly performances from the last five years have come from runners of African nationality. Using this data, it seems fairly safe to predict that the first sub-two-hour
Table 6. Actual WR versus predicted WR 2002–2011
| Year | Actual Time | Athlete (Nation) | FAP – Martin Data Predicted | % Diff | FAP – ARRS Data Predicted | % Diff | WR Data Predicted | % Diff |
|---|---|---|---|---|---|---|---|---|
| 2002.4 | 2:05:38 | Khalid Khannouchi (USA) | 2:04:40 | 0.8% | 2:04:53 | 0.6% | 2:04:20 | 1.0% |
| 2003.7 | 2:04:55 | Paul Tergat (KEN) | 2:04:24 | 0.4% | 2:04:37 | 0.2% | 2:04:07 | 0.6% |
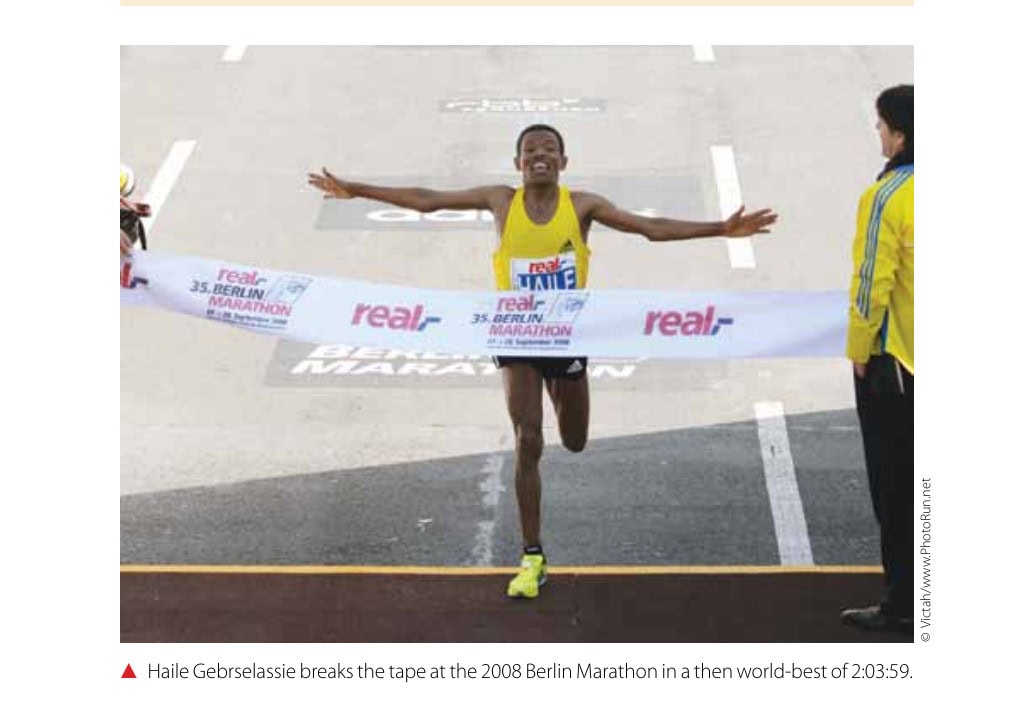
| 2007.7 | 2:04:26 | Haile Gebrselassie (ETH) | 2:03:36 | 0.7% | 2:03:51 | 0.5% | 2:03:28 | 0.8% |
| 2008.7 | 2:03:59 | Haile Gebrselassie (ETH) | 2:03:24 | 0.5% | 2:03:39 | 0.3% | 2:03:18 | 0.6% |
| 2011.7 | 2:03:38 | Patrick Makau (KEN) | 2:02:50 | 0.7% | 2:03:07 | 0.4% | 2:02:51 | 0.6% |
Table 7. Strongest marathon nations
| 2007 | 2008 | 2009 | 2010 | 2011 | ||||||||||
|---|---|---|---|---|---|---|---|---|---|---|---|---|---|---|
| Nation | Ath | Pts | Nation | Ath | Pts | Nation | Ath | Pts | Nation | Ath | Pts | Nation | Ath | Pts |
| KEN | 65 | 3156 | KEN | 68 | 3504 | KEN | 62 | 3333 | KEN | 58 | 2982 | KEN | 65 | 3597 |
| ETH | 8 | 431 | ETH | 13 | 646 | ETH | 26 | 1113 | ETH | 29 | 1587 | ETH | 18 | 760 |
| MAR | 3 | 229 | JPN | 7 | 273 | MAR | 3 | 270 | MAR | 5 | 234 | MAR | 6 | 170 |
| JPN | 5 | 196 | MAR | 4 | 229 | RSA | 1 | 72 | ERI | 1 | 58 | ERI | 2 | 121 |
| CHN | 2 | 129 | ERI | 2 | 107 | UKR | 1 | 57 | UGA | 1 | 52 | USA | 2 | 96 |
marathon performance will be run by a distance athlete from Africa, and if the trend toward the incredible Kenyan dominance continues, by one of its running stars.
Can we go one step further? For those who really like to dream of knowing the future, we could go so far as to ask where the first sub-two-hour performance might occur. Table 8 shows the top 10 fastest marathon courses in the world, based on the average of the 10 fastest finish times. Based on the current data, Berlin is the most likely venue to produce the historic sub-2:00 feat, but over the next 20 years, new faster courses may arise or existing ones may be revised. As the athlete who achieves such a feat will be immortalized, so too will the race venue; therefore, it is likely that event organizers will continue to fine-tune the race environment as much as possible (such as large prize purses to attract the best runners and coordinated aids such as rabbits and fluid/carbohydrate delivery “on demand” from course vehicles) to help produce fast finish times and record-breaking performances. It’s too much of a brazen stretch to try to predict the location of the first sub-two-hour accomplishment, but over the next few years, keep your calendars marked for the venues shown in table 8, as they are the most likely locations to produce world-record and/or annual-best marathon performances.
Where do we go from here? What predictions can we make about the female marathon population? Is it possible for a woman to break two hours? Because the women’s event is so much younger than the men’s (by 60 years in terms of Olympic participation), we unfortunately don’t have enough data on the women’s side to draw trend lines and make accurate predictions on future marathon performances. We do know, however, that a difference of about 10 percent separates the men’s times from the women’s across all standard running events from the 200 meters to the 42K distance, where an 8.7 percent time difference currently exists (Peronnet and Thibault 1989; Cheuvront et al. 2005). Given this, it is possible to estimate a theoretical fastest possible female marathon time using our current models (table 9).
In summary, our models predict that the first sub-two-hour male marathon performance will occur between 2029 and 2032, with a theoretical fastest possible time in the range of 1:50:54 to 1:52:56. Taking an audacious leap, we predict that this feat will likely be achieved by a runner from an African nation. We acknowledge that numerous mechanistic (flat course, cool temperature, cloudy skies, no wind, and so forth) as well as humanistic (excellent competition, ideal physiological attributes, optimally executed race tactics) details need to line up in an optimal manner for this milestone to be achieved. It’s anyone’s guess as to exactly when and where it will happen, so we’ll leave it up to the athletes to give us the answer.
Table 8. Fastest marathon courses*
| Marathon | Top 10 Avg Finish Times | Event Month |
|---|---|---|
| 1. Berlin | 2:04:55 | September |
| 2. Rotterdam | 2:05:07 | April |
| 3. London | 2:05:21 | April |
| 4. Boston | 2:05:39 | April |
| 5. Frankfurt | 2:05:45 | October |
| 6. Chicago | 2:05:58 | October |
| 7. Amsterdam | 2:06:12 | October |
| 8. Paris | 2:06:28 | April |
| 9. Fukuoka | 2:06:47 | December |
| 10. Dubai | 2:06:52 | January |
*Through December 2011
Table 9. Ultimate marathon performance predictions—females
| Martin AP Data | ARRS AP Data | WR Data | |
|---|---|---|---|
| Ultimate performance (@ 8.7% sex difference) | 2:00:33 | 2:02:45 | 2:04:11 |
| Ultimate performance (@ 10% sex difference) | 2:01:59 | 2:04:14 | 2:05:40 |
Table 1. Annual fastest marathon performances by men (Martin data)
| Year | Athlete (Nation) | Time | Venue |
|---|---|---|---|
| 1924 | Shizo Kanaguri (JPN) | 2:36:10 | Tokyo, JPN |
| 1925 | Albert Michelsen (USA) | 2:29:02 | Port Chester, USA |
| 1926 | Iivari Rötkö (FIN) | 2:34:26 | Helsinki, FIN |
| 1927 | Albert Michelsen (USA) | 2:31:11 | Port Chester, USA |
| 1928 | Boughera El Ouafi (MAR) | 2:32:57 | Amsterdam, NED |
| 1929 | Harry Payne (GBR) | 2:30:58 | Stamford Bridge, ENG |
| 1930 | Clarence DeMar (USA) | 2:34:45 | Los Angeles, USA |
| 1931 | Albert Michelsen (USA) | 2:32:35 | West New York, USA |
| 1932 | Tanji Yahagi (JPN) | 2:31:31 | Tokyo, JPN |
| 1933 | Kozo Kusunoki (JPN) | 2:31:10 | Tokyo, JPN |
| 1934 | Patrick Dengis (USA) | 2:31:30 | Port Chester, USA |
| 1935 | Kitei Son (JPN) | 2:26:42 | Tokyo, JPN |
| 1936 | Kitei Son (JPN) | 2:28:32 | Tokyo, JPN |
| 1937 | Manuel Dias (POR) | 2:30:38 | Lisboa, POR |
| 1938 | Patrick Dengis (USA) | 2:30:28 | Salisbury, USA |
| 1939 | Go Toyu (KOR) | 2:31:26 | Tokyo, JPN |
| 1940 | Ellison Brown (USA) | 2:27:30 | Salisbury, USA |
| 1941 | Salvatore Costantino (ITA) | 2:32:33 | Padua, ITA |
| 1942 | Zaiten Kimoto (JPN) | 2:31:38 | Tokyo, JPN |
| 1943 | Clayton Farrar (USA) | 2:39:30 | Yonkers, USA |
| 1944 | Donald Heinicke (USA) | 2:45:05 | Yonkers, USA |
| 1945 | Sven Hakansson (SWE) | 2:36:37 | Göteborg, SWE |
| 1946 | Mikko Hietanen (FIN) | 2:31:37 | Vuoksenniska, FIN |
| 1947 | Mikko Hietanen (FIN) | 2:30:58 | Loughborough, ENG |
| 1948 | Mikko Hietanen (FIN) | 2:31:02 | Vuoksenniska, FIN |
| 1949 | Salomon Komonen (FIN) | 2:28:40 | Turku, FIN |
| 1950 | Feodosiy Vanin (URS) | 2:29:10 | Moskva, URS |
| 1951 | Veikko Karvonen (FIN) | 2:28:08 | Tampere, FIN |
| 1952 | James Peters (GBR) | 2:20:43 | Chiswick, ENG |
| 1953 | James Peters (GBR) | 2:18:35 | Turku, FIN |
| 1954 | James Peters (GBR) | 2:17:40 | Chiswick, ENG |
| 1955 | Veikko Karvonen (FIN) | 2:21:22 | Kobenhavn, DEN |
| 1956 | Paavo Kotila (FIN) | 2:18:05 | Pieksamaki, FIN |
| 1957 | Sergey Popov (URS) | 2:19:50 | Moskva, URS |
| 1958 | Sergey Popov (URS) | 2:15:17 | Stockholm, SWE |
| 1959 | Sergey Popov (URS) | 2:17:46 | Kosice, SVK |
| 1960 | Abebe Bikila (ETH) | 2:15:17 | Roma, ITA |
| 1961 | Takayuki Nakao (JPN) | 2:18:54 | Nagoya, JPN |
| 1962 | Yu-Mang Hyang (PRK) | 2:16:10 | Pyongyang, PRK |
| 1963 | Leonard Edelen (USA) | 2:14:28 | Chiswick, ENG |
| 1964 | Abebe Bikila (ETH) | 2:12:12 | Tokyo, JPN |
| 1965 | Morio Shigematsu (JPN) | 2:12:00 | Chiswick, ENG |
| 1966 | Alastair Wood (GBR) | 2:13:45 | Forres, ENG |
| 1967 | Derek Clayton (AUS) | 2:09:37 | Fukuoka, JPN |
| 1968 | William Adcocks (GBR) | 2:10:48 | Fukuoka, JPN |
| 1969 | Derek Clayton (AUS) | 2:08:34 | Antwerpen, BEL |
| 1970 | Ronald Hill (GBR) | 2:09:28 | Edinburgh, ENG |
| 1971 | Derek Clayton (AUS) | 2:11:09 | Hobart, AUS |
| 1972 | Frank Shorter (USA) | 2:10:30 | Fukuoka, JPN |
| 1973 | John Farrington (GBR) | 2:11:13 | Richmond, ENG |
| 1974 | Ian Thompson (GBR) | 2:09:12 | Christchurch, NZL |
| 1975 | Bill Rodgers (USA) | 2:09:56 | Boston, USA |
| 1976 | Waldemar Cierpinski (GER) | 2:09:55 | Montreal, CAN |
| 1977 | Bill Rodgers (USA) | 2:10:56 | Fukuoka, JPN |
| 1978 | Shigeru Soh (JPN) | 2:09:06 | Oita, JPN |
| 1979 | Bill Rodgers (USA) | 2:09:28 | Boston, USA |
| 1980 | Gerard Nijboer (NED) | 2:09:01 | Amsterdam, NED |
| 1981 | Rob de Castella (AUS) | 2:08:18 | Fukuoka, JPN |
| 1982 | Alberto Salazar (USA) | 2:08:52 | Boston, USA |
| 1983 | Rob de Castella (AUS) | 2:07:51 | Boston, USA |
| 1984 | Steve Jones (GBR) | 2:08:05 | Chicago, USA |
| 1985 | Carlos Lopes (POR) | 2:07:12 | Rotterdam, NED |
| 1986 | Taisuke Kodama (JPN) | 2:07:35 | Beijing, CHN |
| 1987 | Takeyuki Nakayama (JPN) | 2:08:18 | Fukuoka, JPN |
| 1988 | Belayneh Dinsamo (ETH) | 2:06:50 | Rotterdam, NED |
| 1989 | Juma Ikangaa (TAN) | 2:08:01 | New York, USA |
| 1990 | Stephen Moneghetti (AUS) | 2:08:16 | Berlin, FRG |
| 1991 | Koichi Morishita (JPN) | 2:08:53 | Oita, JPN |
| 1992 | David Tsebe (RSA) | 2:08:07 | Berlin, GER |
| 1993 | Dionicio Ceron (MEX) | 2:08:51 | Fukuoka, JPN |
| 1994 | Cosmas Ndeti (KEN) | 2:07:15 | Boston, USA |
| 1995 | Samuel Lelei (KEN) | 2:07:02 | Berlin, GER |
| 1996 | Martin Fiz (ESP) | 2:08:25 | Kyongju, KOR |
| 1997 | Khalid Khannouchi (MAR) | 2:07:10 | Chicago, USA |
| 1998 | Ronaldo da Costa (BRA) | 2:06:05 | Berlin, GER |
| 1999 | Khalid Khannouchi (MAR) | 2:05:42 | Chicago, USA |
| 2000 | Antonio Pinto (POR) | 2:06:36 | London, ENG |
| 2001 | Josephat Kiprono (KEN) | 2:06:50 | Rotterdam, NED |
| 2002 | Khalid Khannouchi (USA) | 2:05:38 | London, ENG |
| 2003 | Paul Tergat (KEN) | 2:04:55 | Berlin, GER |
| 2004 | Felix Limo (KEN) | 2:06:14 | Rotterdam, NED |
| 2005 | Haile Gebrselassie (ETH) | 2:06:20 | Amsterdam, NED |
| 2006 | Haile Gebrselassie (ETH) | 2:05:56 | Berlin, GER |
| 2007 | Haile Gebrselassie (ETH) | 2:04:26 | Berlin, GER |
| 2008 | Haile Gebrselassie (ETH) | 2:03:59 | Berlin, GER |
| 2009 | Duncan Kibet (KEN) | 2:04:27 | Rotterdam, NED |
| 2010 | Patrick Makau (KEN) | 2:04:48 | Rotterdam, NED |
| 2011 | Geoffrey Mutai (KEN) | 2:03:02 | Boston, USA |
Table 2. Annual fastest marathon performances by men (ARRS data)
| Year | Athlete (Nation) | Time | Venue |
|---|---|---|---|
| 1924 | Shizo Kanaguri (JPN) | 2:36:10 | Tokyo, JPN |
| 1925 | Samuel Ferris (GBR) | 2:35:58 | Windsor, ENG |
| 1926 | Iivari Rötkö (FIN) | 2:34:25 | Helsinki, FIN |
| 1927 | Verner Laaksonen (FIN) | 2:35:21 | Helsinki, FIN |
| 1928 | Boughera El Ouafi (FRA) | 2:32:57 | Amsterdam, NED |
| 1929 | Harry Payne (GBR) | 2:30:58 | London, ENG |
| 1930 | Fukutaro Shibui (JPN) | 2:36:33 | Tokyo, JPN |
| 1931 | Juan Zabala (ARG) | 2:33:19 | Kosice, SVK |
| 1932 | Tanji Yahagi (JPN) | 2:31:31 | Tokyo, JPN |
| 1933 | Kozo Kusunoki (JPN) | 2:31:10 | Tokyo, JPN |
| 1934 | Tamao Shiaku (JPN) | 2:32:56 | Osaka, JPN |
| 1935 | Kee-Jung Sohn (KOR) | 2:26:14 | Tokyo, JPN |
| 1936 | Kee-Jung Sohn (KOR) | 2:28:32 | Tokyo, JPN |
| 1937 | Manuel Dias (POR) | 2:30:38 | Lisbon, POR |
| 1938 | Pat Dengis (USA) | 2:30:28 | Salisbury Beach, USA |
| 1939 | Go Toyu (KOR) | 2:31:26 | Tokyo, JPN |
| 1940 | Shoichiro Takenaka (JPN) | 2:33:42 | Tokyo, JPN |
| 1941 | Leslie Pawson (USA) | 2:31:27 | Salisbury Beach, USA |
| 1942 | Zaiten Kimoto (JPN) | 2:31:38 | Tokyo, JPN |
| 1943 | Gérard Coté (CAN) | 2:38:35 | Yonkers, USA |
| 1944 | Charles Robbins (USA) | 2:40:49 | Yonkers, USA |
| 1945 | Sven Hakansson (SWE) | 2:36:38 | Göteborg, SWE |
| 1946 | Mikko Hietanen (FIN) | 2:31:37 | Vuoksenniska, FIN |
| 1947 | Mikko Hietanen (FIN) | 2:30:58 | Loughborough, ENG |
| 1948 | Mikko Hietanen (FIN) | 2:31:02 | Stockholm, SWE |
| 1949 | Salomon Könönen (FIN) | 2:28:39 | Turku, FIN |
| 1950 | Fyeodosiy Vanin (SOV) | 2:29:09 | Moskva, URS |
| 1951 | Veikko Karvonen (FIN) | 2:28:07 | Tampere, FIN |
| 1952 | James Peters (GBR) | 2:20:42 | Chiswick, ENG |
| 1953 | James Peters (GBR) | 2:18:35 | Turku, FIN |
| 1954 | James Peters (GBR) | 2:17:39 | Chiswick, ENG |
| 1955 | Veikko Karvonen (FIN) | 2:21:22 | Kobenhavn, DEN |
| 1956 | Paavo Kotila (FIN) | 2:18:05 | Pieksamaki, FIN |
| 1957 | Sergey Popov (RUS) | 2:19:50 | Moskva, URS |
| 1958 | Sergey Popov (RUS) | 2:15:18 | Stockholm, SWE |
| 1959 | Sergey Popov (RUS) | 2:17:45 | Kosice, SVK |
Table 2. Continued
| Year | Athlete (Nation) | Time | Venue |
|---|---|---|---|
| 1960 | Abebe Bikila (ETH) | 2:15:16 | Roma, ITA |
| 1961 | Takayuki Nakao (JPN) | 2:18:54 | Nagoya, JPN |
| 1962 | Mang-Hyang Yu (PRK) | 2:16:10 | Pyongyang, PRK |
| 1963 | Leonard Edelen (USA) | 2:14:28 | Chiswick, ENG |
| 1964 | Abebe Bikila (ETH) | 2:12:11 | Tokyo, JPN |
| 1965 | Morio Shigematsu (JPN) | 2:12:00 | Chiswick, ENG |
| 1966 | Alastair Wood (GBR) | 2:13:45 | Forres, ENG |
| 1967 | Derek Clayton (AUS) | 2:09:36 | Fukuoka, JPN |
| 1968 | William Adcocks (GBR) | 2:10:48 | Fukuoka, JPN |
| 1969 | William Adcocks (GBR) | 2:11:07 | Athens, GRE |
| 1970 | Ron Hill (GBR) | 2:09:29 | Edinburgh, SCO |
| 1971 | Derek Clayton (AUS) | 2:11:09 | Hobart, AUS |
| 1972 | Frank Shorter (USA) | 2:10:30 | Fukuoka, JPN |
| 1973 | John Farrington (AUS) | 2:11:13 | Sydney, AUS |
| 1974 | Ian Thompson (GBR) | 2:09:12 | Christchurch, NZL |
| 1975 | Bill Rodgers (USA) | 2:09:56 | Boston, USA |
| 1976 | Waldemar Cierpinski (GER) | 2:09:55 | Montreal, CAN |
| 1977 | Bill Rodgers (USA) | 2:10:55 | Fukuoka, JPN |
| 1978 | Shigeru So (JPN) | 2:09:06 | Beppu, JPN |
| 1979 | Bill Rodgers (USA) | 2:09:28 | Boston, USA |
| 1980 | Gerard Nijboer (NED) | 2:09:01 | Amsterdam, NED |
| 1981 | Rob de Castella (AUS) | 2:08:18 | Fukuoka, JPN |
| 1982 | Alberto Salazar (USA) | 2:08:52 | Boston, USA |
| 1983 | Rob de Castella (AUS) | 2:08:37 | Rotterdam, NED |
| 1984 | Steve Jones (GBR) | 2:08:05 | Chicago, USA |
| 1985 | Carlos Lopes (POR) | 2:07:12 | Rotterdam, NED |
| 1986 | Rob de Castella (AUS) | 2:07:51 | Boston, USA |
| 1987 | Takeyuki Nakayama (JPN) | 2:08:18 | Fukuoka, JPN |
| 1988 | Belayneh Dinsamo (ETH) | 2:06:50 | Rotterdam, NED |
| 1989 | Juma Ikangaa (TAN) | 2:08:01 | New York, USA |
| 1990 | Steve Moneghetti (AUS) | 2:08:16 | Berlin, GER |
| 1991 | Koichi Morishita (JPN) | 2:08:53 | Beppu, JPN |
| 1992 | David Tsebe (RSA) | 2:08:07 | Berlin, GER |
| 1993 | Dionicio Ceron (MEX) | 2:08:51 | Fukuoka, JPN |
| 1994 | Cosmas Ndeti (KEN) | 2:07:15 | Boston, USA |
| 1995 | Sammy Lelei (KEN) | 2:07:02 | Berlin, GER |
| 1996 | Martin Fiz (ESP) | 2:08:25 | Kyong-Ju, KOR |
| 1997 | Khalid Khannouchi (MAR) | 2:07:10 | Chicago, USA |
| 1998 | Ronaldo da Costa (BRA) | 2:06:05 | Berlin, GER |
| 1999 | Khalid Khannouchi (MAR) | 2:05:42 | Chicago, USA |
| 2000 | Antonio Pinto (POR) | 2:06:36 | London, ENG |
| 2001 | Josephat Kiprono (KEN) | 2:06:50 | Rotterdam, NED |
| 2002 | Khalid Khannouchi (USA) | 2:05:38 | London, ENG |
| 2003 | Paul Tergat (KEN) | 2:04:55 | Berlin, GER |
| 2004 | Evans Rutto (KEN) | 2:06:16 | Chicago, USA |
| 2005 | Haile Gebrselassie (ETH) | 2:06:20 | Amsterdam, NED |
| 2006 | Haile Gebrselassie (ETH) | 2:05:56 | Berlin, GER |
| 2007 | Haile Gebrselassie (ETH) | 2:04:26 | Berlin, GER |
| 2008 | Haile Gebrselassie (ETH) | 2:03:58 | Berlin, GER |
| 2009 | Duncan Kibet (KEN) | 2:04:26 | Rotterdam, NED |
| 2010 | Patrick Makau (KEN) | 2:04:48 | Rotterdam, NED |
| 2011 | Geoffrey Mutai (KEN) | 2:03:02 | Boston, USA |
Table 3. Marathon world record progression (IAAF data)
| Year | Time | Athlete | Nation | Venue |
|---|---|---|---|---|
| 1925 | 2:29:01 | Albert Michelson | USA | Port Chester, USA |
| 1935 | 2:27:49 | Fushashige Suzuki | JPN | Tokyo, JPN |
| 1935 | 2:26:44 | Yashuo Ikenaka | JPN | Tokyo, JPN |
| 1935 | 2:26:42 | Kitei Son | JPN | Tokyo, JPN |
| 1947 | 2:25:39 | Yun Bok Suh | KOR | Boston, USA |
| 1952 | 2:20:42 | Jim Peters | GBR | Chiswick, ENG |
| 1953 | 2:18:40 | Jim Peters | GBR | Chiswick, ENG |
| 1953 | 2:18:34 | Jim Peters | GBR | Turku, FIN |
| 1954 | 2:17:39 | Jim Peters | GBR | Chiswick, ENG |
| 1958 | 2:15:17 | Sergey Popov | URS | Stockholm, SWE |
| 1960 | 2:15:16 | Abebe Bikila | ETH | Rome, ITA |
| 1963 | 2:15:15 | Toru Terasawa | JPN | Beppu, JPN |
| 1963 | 2:14:28 | Leonard Edelen | USA | Chiswick, ENG |
| 1964 | 2:13:55 | Basil Heatley | GBR | Chiswick, ENG |
| 1964 | 2:12:11 | Abebe Bikila | ETH | Tokyo, JPN |
| 1965 | 2:12:00 | Morio Shigematsu | JPN | Chiswick, ENG |
| 1967 | 2:09:36 | Derek Clayton | AUS | Fukuoka, JPN |
| 1969 | 2:08:34 | Derek Clayton | AUS | Antwerp, BEL |
| 1981 | 2:08:18 | Rob de Castella | AUS | Fukuoka, JPN |
| 1984 | 2:08:05 | Steve Jones | GBR | Chicago, USA |
| 1985 | 2:07:12 | Carlos Lopes | POR | Rotterdam, NED |
| 1988 | 2:06:50 | Belayneh Dinsamo | ETH | Rotterdam, NED |
| 1988 | 2:06:05 | Ronaldo da Costa | BRA | Berlin, GER |
| 1999 | 2:05:42 | Khalid Khannouchi | MAR | Chicago, USA |
| 2002 | 2:05:38 | Khalid Khannouchi | USA | London, ENG |
| 2003 | 2:04:55 | Paul Tergat | KEN | Berlin, GER |
| 2007 | 2:04:26 | Haile Gebrselassie | ETH | Berlin, GER |
| 2008 | 2:03:59 | Haile Gebrselassie | ETH | Berlin, GER |
| 2011 | 2:03:38 | Patrick Makau | KEN | Berlin, GER |
References
- Cheuvront, S. N., R. Carter, K. C. DeRuisseau, and R. J. Moffatt. 2005. Running performance differences between men and women: an update. Sports Medicine 35(12):1017-1024.
- Henry, F. M. 1954. Prediction of world records in running sixty yards to twenty-six miles. Research Quarterly 26:147-158.
- Joyner, M. J. 1991. Modeling: optimal marathon performance on the basis of physiological factors. Journal of Applied Physiology 70(2):683-687.
- Lietzke, M. H. 1954. An analytical study of world and Olympic racing records. Science 119(3089):333-336.
- Lloyd, B. B. 1966. The energetics of running: an analysis of world records. Advancement of Science 22(103):515-530.
- Liu, Y., and R. W. Schutz. 1998. Prediction models for track and field performances. Measurement in Physical Education and Exercise Science 2(4):205-223.
- Martin, D. E., and D. Benardot. 2008. Prediction of future marathon performances using regression analysis of past annual fastest times. Medicine & Science in Sports & Exercise 40:S268.
- Mognoni, P., C. Lafortuna, G. Russo, and A. Minetti. 1982. An analysis of world records in three types of locomotion. European Journal of Applied Physiology and Occupational Physiology 49(3):287-299.
- Morton, R. H. 1983. The supreme runner: what evidence now? Australian Journal of Sport Sciences 3(2):7-10.
- Nevill, A. M., and G. Whyte. 2005. Are there limits to running world records? Medicine & Science in Sports & Exercise 37(10):1785-1788.
- Peronnet, F., and G. Thibault. 1989. Mathematical analysis of running performance and world running records. Journal of Applied Physiology 67(1):453-465.
- Rumball, W. M., and C. E. Coleman. 1970. Analysis of running and the prediction of ultimate performance. Nature 228(5267):184-185.
- Ryder, W. H., H. J. Carr, and P. Herget. 1976. Future performance in footracing. Scientific American 234(6):109-119.
Runners worry about training schedules, race performances, fueling, heart rates, and nagging injuries, and they follow elaborate schedules to reach long-term goals. Many runners, however, fail to think of protecting themselves from sun damage and skin cancer risks from cumulative sun exposure or blistering burns while training and racing. According to one study in the Archives of Dermatology (2006) of marathon runners and melanoma risk factors, 44 percent of the marathoners in the study did not use sunscreen regularly.
Endurance athletes such as marathoners and ultrarunners tend to spend many hours training in the sun through various seasons and conditions. Water, snow, and sand can reflect ultraviolet rays. Even on cloudy days, a significant amount of ultraviolet radiation penetrates the clouds. But sun protection is of utmost importance. Sun exposure is the single most preventable risk factor for skin cancer. Sun exposure also causes aging of the skin, resulting in wrinkles, skin laxity, and age spots. Sun damage to the eyes contributes to cataracts and macular degeneration.
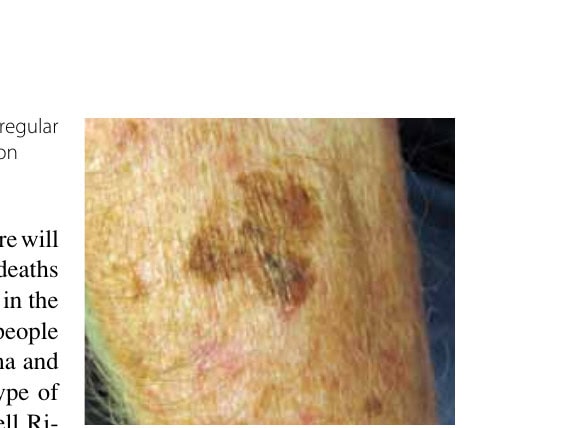
Melanoma often develops as a result of excess sun exposure and sunburns. The use of tanning beds may contribute to the prevalence of melanoma, especially in young women. Malignant melanoma can be a devastating disease. In its early stages, melanoma may be cured with surgical removal, known as a wide local excision. This can result in significant scarring. When melanoma results in an invasive lesion, surgery to check for lymph-node involvement is often done. This may lead to a permanently swollen limb. Despite the best, most appropriate care, melanoma has the potential to spread widely to other areas of the skin, liver, lungs, lymph nodes, and brain, leading to death. Approximately one American dies every hour from melanoma, and there will be an estimated 9,180 Americans deaths this year. The current lifetime risk in the United States is that one out of 52 people will develop an invasive melanoma and one out of 27 will develop any type of melanoma, according to Dr. Darrell Rigel (2012). Melanoma can even develop in children, often in conjunction with a birthmark. The risk of melanoma begins to increase at puberty. It is the most common form of cancer in young adults age 25 to 29, according to the American Academy of Dermatology (2012).
Marathon runners often show signs on their skin that are associated with an increased risk of melanoma. Notable runners who have suffered from melanoma include John J. Kelley, who died from metastatic melanoma, and Deena Kastor, who has reportedly had three early melanomas. A study published in the Archives of Dermatology (2006) found that marathon runners showed significantly more atypical nevi and solar lentigines (sun spots/age spots), as well as suspicious lesions requiring surgical removal, than age-matched controls. These changes are considered risk factors for the development of melanoma. The more hours spent training per week, the more striking the differences noted.
Besides sun exposure and genetic factors, it has also been suggested that intense training and competition may cause a decline in immune regulation. Any decrease in immune competence may result in an increased propensity for malignancy.
Risk factors for melanoma include
- More than 50 moles, large or atypical moles
- Light skin with red or blond hair, blue or green eyes
- Family history of melanoma
- Personal history of melanoma (higher risk for subsequent melanomas)
- History of sunburns
- Tanning-bed use
- Immunosuppressive therapy, such as medications used in transplant patients or for some patients with psoriasis or rheumatoid arthritis
This article originally appeared in Marathon & Beyond, Vol. 16, No. 5 (2012).
← Browse the full M&B ArchiveMore like this
1,000+ stories from 19 years of Marathon & Beyond
The complete archive of the legendary long-distance journal — digitized and free to read.
