


Wet-bulb globe temperature, or WBGT, compresses heat, humidity, wind, and radiant heat into a single number. Race organizers and athletes use it to sort conditions into risk bands. The question is whether runners’ physiological responses separate as neatly as these risk bands assume.
A new systematic review and meta-analysis analyzed 43 studies, involving trained adults performing self-paced runs ranging from 5K to the marathon. A total of 58% of the studies were conducted indoors.

The researchers grouped conditions using American College of Sports Medicine (ACSM) thresholds: low risk at 72.0°F WBGT or below, moderate from 72.1°F to 78.1°F, high from 78.3°F to 82.0°F, and very high at 82.2°F or above (in Celsius, that’s 22.2°C, 22.3°C to 25.6°C, 25.7°C to 27.8°C, and 27.9°C or above for low, moderate, high, and very high risk, respectively).
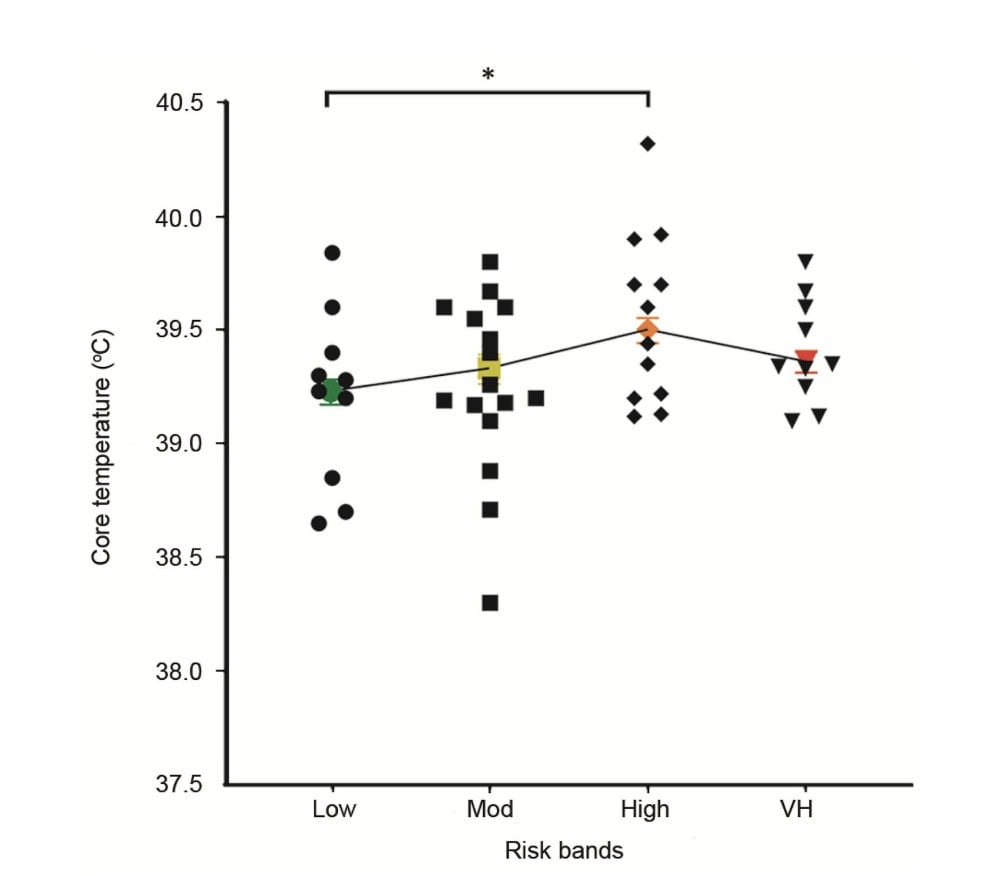
- Runners’ core temperatures at the end of exercise rose from 102.61°F (39.23°C) in low-risk conditions to 102.79°F (39.33°C) in moderate risk and 103.10°F (39.50°C) in high risk, then dipped to 102.85°F (39.36°C) in very-high-risk conditions.
- Heart rate showed a similar separation: 181 beats per minute in both low and moderate risk and 185 beats per minute in both high and very high risk.
- Body-mass loss averaged 1.4% to 1.8% across categories, with no significant differences between the temperature conditions.
- Running speed declined as heat risk increased, even though there wasn’t much of a statistical difference when comparing conditions.
What this means for runners
A higher WBGT should probably push you toward a more conservative pace, more attention to access to fluids and cooling, and a lower threshold for adjusting the day’s goal. But the same number can create very different strain depending on acclimatization, fitness, health, clothing, sun exposure, air movement, race duration, and how hard you choose to run.
The overlap (or lack of a “statistical difference) between risk bands is not permission to ignore a high-risk forecast. If anything, it is a reminder that a population-level cutoff cannot tell you exactly what your core temperature or performance will be on the day.
RunClub — Free
Join 300,000+ runners in RunClub
Free training plans for every distance, a daily running game, exclusive coaching content, and a real community of runners. Create your free account in 20 seconds — no card.
Already a member? Log in →











Start the conversation