


New research on more than one million marathon performances ranks the fastest marathon courses vs slower courses. The same paper also predicts the likely arc of your personal marathon-running career.
Will you get faster after you’ve run your first marathon? By how much? How does age affect your career arc? Now we have answers that previously proved elusive.
The answers come from a new preprint paper, Ranking Marathon Difficulty from Large, Sparse Data: A Robust Latent-Factor Approach,1View of Ranking Marathon Difficulty from Large, Sparse Data: A Robust Latent-Factor Approach. (2026). Sportrxiv.Org. https://sportrxiv.org/index.php/server/preprint/view/942/2043 from physicist and 3:16 marathon runner Yi Hua Chang. He analyzed the results of 400,000-plus runners who completed more than 300 runnings of 46 popular marathons from 2014 to 2025.
Chang’s paper stands out from prior work in that he only included runners for whom he could find at least two marathon finishes. For many, he found six to 10 finishes. This allowed him to isolate the “drift” (his term) or career arc of multiple-time marathon runners.
Previous course rankings tended to include only a small slice of all finishers, perhaps the podium placers or top 10 percent. Chang included all finishers for whom he could find two or more additional results.
He focused on European marathons, especially those in the U.K., because that’s where he lives and where he found the highest quality finish-time data. His U.S. results include the big three marathons: Boston, New York, and Chicago.
The fastest course turns out to be the Newport Marathon in Newport, Wales, UK. By comparison, the Boston Marathon ranks 39th overall, two spots ahead of New York City in 41st. (See the end of this article for Chang’s full ranking of marathon courses.)
Boston’s low rank represents a paradox of sorts. Other studies place Boston high for average finish time. After all, the stiff qualifying standards eliminate 90 percent of potential runners. Also, the downhill course is considered “aided,” and therefore too fast to be eligible for official world records.
But Chang’s analysis shows otherwise. Runners tend to run slower at Boston than in other marathons. This probably occurs because Boston has highly variable springtime weather, sometimes chilly, sometimes hot and unshaded, and tough hills in all the wrong places.
How Much Can You Improve Your Marathon Time?
Some runners are one-and-done after their first marathon, but many tackle more. They are intrigued by the 26.2-mile challenge and aim to get faster. But how much can you actually improve?
Chang’s paper is the first to attack this question, thanks to the repeat-marathons aspect of runners in his database. If you train smart and consistently, Chang concludes, you can improve as much as 15 percent from your first marathon. He eliminates clearly sub-par, “hit the wall” marathon performances, as these represent mistakes with little informative power.
For a 3-hour runner, a 15 percent improvement brings you down to 2:33. For a 5-hour marathoner, you can get to 4:15.
The amount you improve depends partially on your age at first marathon. Those who begin in their mid-30s and continue their training regimens can look forward to 7 years of improvement.
At the other end of the spectrum, those who begin in their mid-60s face tougher odds. They will likely enjoy just one year of improvement, and are unlikely to reach 15 percent.
That said, there are always individual outliers. There’s no rule limiting how hard you train or your chances for superior results.
Chang himself observed: “The top 10 percent of responders in my dataset continued to compound their fitness, improving by as much as 15 percent or more over a seven-year span.”
His use of “compound” to make an analogy to financial health is a useful concept for runners. If you put money in an interest-bearing account, your funds grow year over year even if you don’t do anything special. You simply safeguard the account.
The same goes for marathon training. If you establish a sustainable training program, your fitness and marathon times improve year over year even if you don’t do anything new and different. You only have to safeguard your training.
What Makes A Fast Marathon Fast?
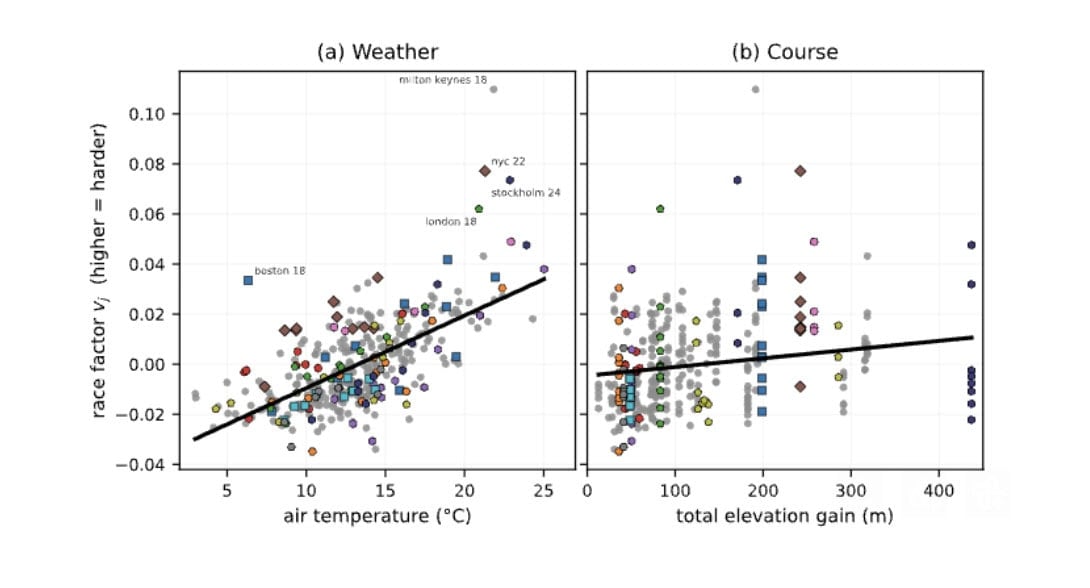
When Chang looked to distinguish fast marathon courses from slower ones, he found one particularly powerful variable: race-day temperature. This won’t surprise anyone who has run a marathon in ideal conditions and another on a hot day.
Five individual races/years stood out ahead of all others: Chicago, 2014; Amsterdam, 2025; Berlin, 2014; London, 2015; and Frankfurt, 2015.
All five were run at temperatures of 48 to 59 degrees F, or 10 to 15 degrees C. Three of the five had temperatures at the low end of the scale, between 48 and 50 degrees F (10 to 11 degrees C). This appears to be the ideal temperature for a fast marathon.
The fastest of the group, Chicago 2014 (50 F, 10 C), helped 3:00-hour runners complete the course 6:12 faster than would have been expected on a neutral weather day. The slowest marathons in Chang’s database were run when the thermometer climbed above 66 degrees F, or 19 C.
The Berlin Marathon would have ranked higher overall except for its 2025 edition, which reached 77 F (25 C). This pushed final times 7 minutes slower than expected vs. Berlin’s best weather year (2014; 57 F, or 14 C) when times were 5:24 faster than expected.
The marathons with consistently cool weather (Newport, Zurich, Seville) nabbed the top 3 spots on Chang’s list of fastest courses. Chang says he didn’t find anything unexpected in his results.
“I suppose it’s a little ‘surprising’ that Dublin has some hills, but ranks ahead of a well-known fast course like Valencia,” he notes . “Also, Berlin is fast-ish but not in the top category. But overall I think the results make qualitative sense.”
Hills also affected course rankings, but not nearly as much as higher temps. The two graphs below show the different slopes, or impact factors, of temperature and hills. The steeper the slope, the stronger the effect.
How To Chase A Personal Best Time In The Marathon
There are many reasons to choose a particular marathon, including celebration, challenge, bucket-list quests, and more. You’re never required to aim for a personal best. However, when that is your goal, here are several key things to keep in mind.
1: Don’t obsess about a marathon’s course-elevation map. The temperature on race day is much more important. Look for marathons with consistently-cool weather, in the high 40s or low 50s. Chang’s study found that race-day weather (and hills to a lesser extent) were 3 to 10 times more significant than any other variables.
2: Consider your age and where you are in your career-arc. These aren’t limitations, but they are important issues, and you have to be smart about who and where you are.
3: Training, shoes, fueling, and pacing remain important, no matter what marathon you choose. Train smart, and practice good carbohydrate-fueling before and during your race. Run even pace from the start, or even slightly slower than goal-pace for the first 5K. This will allow you to spare some glycogen, and finish strong.
46 Marathon Courses Ranked Fastest To Slowest
The following table, adapted from Yi Hua Chang’s research, lists 46 marathon courses, ranked from fastest to slowest. The three right-side columns show how fast you might run on each of these courses if you are a 3-hour, 4-hour, or 5-hour marathon runner. Times are averages, so some runners might run considerably faster or slower.
| Marathon (Country) | Difficulty Index | 3:00 Marathon Converts To | 4:00 Marathon Converts To | 5:00 Marathon Converts To |
|---|---|---|---|---|
| 1: Newport (GBR) | -1.75% | 2:56:51 | 3:55:48 | 4:54:45 |
| 2: Zurich (SUI) | -1.58% | 2:57:09 | 3:56:12 | 4:55:15 |
| 3: Seville ESP) | -1.47% | 2:57:21 | 3:56:28 | 4:55:35 |
| 4: Manchester (GBR) | -1.31% | 2:57:39 | 3:56:51 | 4:56:04 |
| 5: Dublin (IRL) | -1.28% | 2:57:42 | 3:56:56 | 4:56:10 |
| 6: Hannover (GER) | -1.25% | 2:57:45 | 3:57:00 | 4:56:15 |
| 7: Eindhoven (NED) | -1.17% | 2:57:54 | 3:57:12 | 4:56:29 |
| 8: Frankfurt (GER) | -1.14% | 2:57:57 | 3:57:16 | 4:56:35 |
| 9: Boston UK (GBR) | -1.08% | 2:58:03 | 3:57:25 | 4:56:46 |
| 10: Barcelona (ESP) | -1.06% | 2:58:05 | 3:57:27 | 4:56:49 |
| 11: Valencia (ESP) | -1.00% | 2:58:12 | 3:57:36 | 4:57:00 |
| 12: Amsterdam (NED) | -0.97% | 2:58:15 | 3:57:40 | 4:57:05 |
| 13: Paris (FRA) | -0.94% | 2:58:18 | 3:57:45 | 4:57:11 |
| 14: Yorkshire (GBR) | -0.92% | 2:58:21 | 3:57:48 | 4:57:14 |
| 15: San Sebastian (ESP) | -0.83% | 2:58:30 | 3:58:00 | 4:57:31 |
| 16: Chester (GBR) | -0.81% | 2:58:32 | 3:58:03 | 4:57:34 |
| 17: Malaga (ESP) | -0.75% | 2:58:39 | 3:58:12 | 4:57:45 |
| 18: Berlin (GER) | -0.64% | 2:58:51 | 3:58:28 | 4:58:05 |
| 19: Rotterdam (NED) | -0.56% | 2:58:59 | 3:58:39 | 4:58:19 |
| 20: Hamburg (GER) | -0.50% | 2:59:06 | 3:58:48 | 4:58:30 |
| 21: Abingdon (GBR) | -0.42% | 2:59:14 | 3:58:59 | 4:58:44 |
| 22: Cologne (GER) | -0.39% | 2:59:18 | 3:59:04 | 4:58:50 |
| 23: Munich (GER) | -0.25% | 2:59:33 | 3:59:24 | 4:59:15 |
| 24: Chicago (USA) | -0.19% | 2:59:39 | 3:59:33 | 4:59:26 |
| 25: Prague (CZE) | -0.08% | 2:59:51 | 3:59:48 | 4:59:46 |
| NEUTRAL COURSE | 0.00% | 3:00:00 | 4:00:00 | 5:00:00 |
| 26: Stockholm (SWE) | +0.03% | 3:00:03 | 4:00:04 | 5:00:05 |
| 27: Tokyo (JPN) | +0.11% | 3:00:12 | 4:00:16 | 5:00:20 |
| 28: London (GBR) | +0.19% | 3:00:21 | 4:00:27 | 5:00:34 |
| 29: Copenhagen (DEN) | +0.28% | 3:00:30 | 4:00:40 | 5:00:50 |
| 30: Edinburgh (GBR) | +0.42% | 3:00:45 | 4:01:00 | 5:01:16 |
| 31: Vienna (AUT) | +0.47% | 3:00:51 | 4:01:08 | 5:01:25 |
| 32: Cape Town (RSA) | +0.61% | 3:01:06 | 4:01:28 | 5:01:50 |
| 33: Oslo (NOR) | +0.69% | 3:01:14 | 4:01:39 | 5:02:04 |
| 34: Belfast (GBR) | +0.89% | 3:01:36 | 4:02:08 | 5:02:40 |
| 35: Madrid (ESP) | +0.89% | 3:01:36 | 4:02:08 | 5:02:40 |
| 36: Milan (ITA) | +0.89% | 3:01:36 | 4:02:08 | 5:02:40 |
| 37: Rome (ITA) | +0.97% | 3:01:45 | 4:02:20 | 5:02:55 |
| 38: Melbourne (AUS) | +1.00% | 3:01:48 | 4:02:24 | 5:03:00 |
| 39: Boston (USA) | +1.06% | 3:01:55 | 4:02:33 | 5:03:11 |
| 40: Brighton (GBR) | +1.19% | 3:02:09 | 4:02:51 | 5:03:34 |
| 41: NYC (USA) | +1.44% | 3:02:36 | 4:03:27 | 5:04:19 |
| 42: Milton Keynes (GBR) | +1.58% | 3:02:51 | 4:03:48 | 5:04:45 |
| 43: Lisbon (POR) | +1.78% | 3:03:12 | 4:04:16 | 5:05:20 |
| 44: Sydney (AUS) | +1.94% | 3:03:30 | 4:04:39 | 5:05:49 |
| 45: HK (HKG) | +2.06% | 3:03:43 | 4:04:57 | 5:06:11 |
| 46: Venice (ITA) | +2.56% | 3:04:37 | 4:06:09 | 5:07:41 |
References
RunClub — Free
Join 300,000+ runners in RunClub
Free training plans for every distance, a daily running game, exclusive coaching content, and a real community of runners. Create your free account in 20 seconds — no card.
Already a member? Log in →









Start the conversation