


There is something slightly strange about the way we study the marathon.
In the laboratory, researchers can control almost everything: treadmill speed, temperature, nutrition, airflow, and precisely when a blood sample is taken. That control is the great strength of laboratory science. But it also creates a problem. Marathon performance unfolds over several hours, under changing environmental conditions, after months or years of training, and in the presence of thousands of other runners. Reproducing all of that in a lab is… well… impossible.
Then there is the sample-size problem. You cannot ask 100,000 runners to complete multiple all-out marathons while randomly changing their training, pacing, altitude, heat exposure, or air pollution. It would be impractical, not to mention costly.
Luckily, runners perform this experiment for us every weekend.
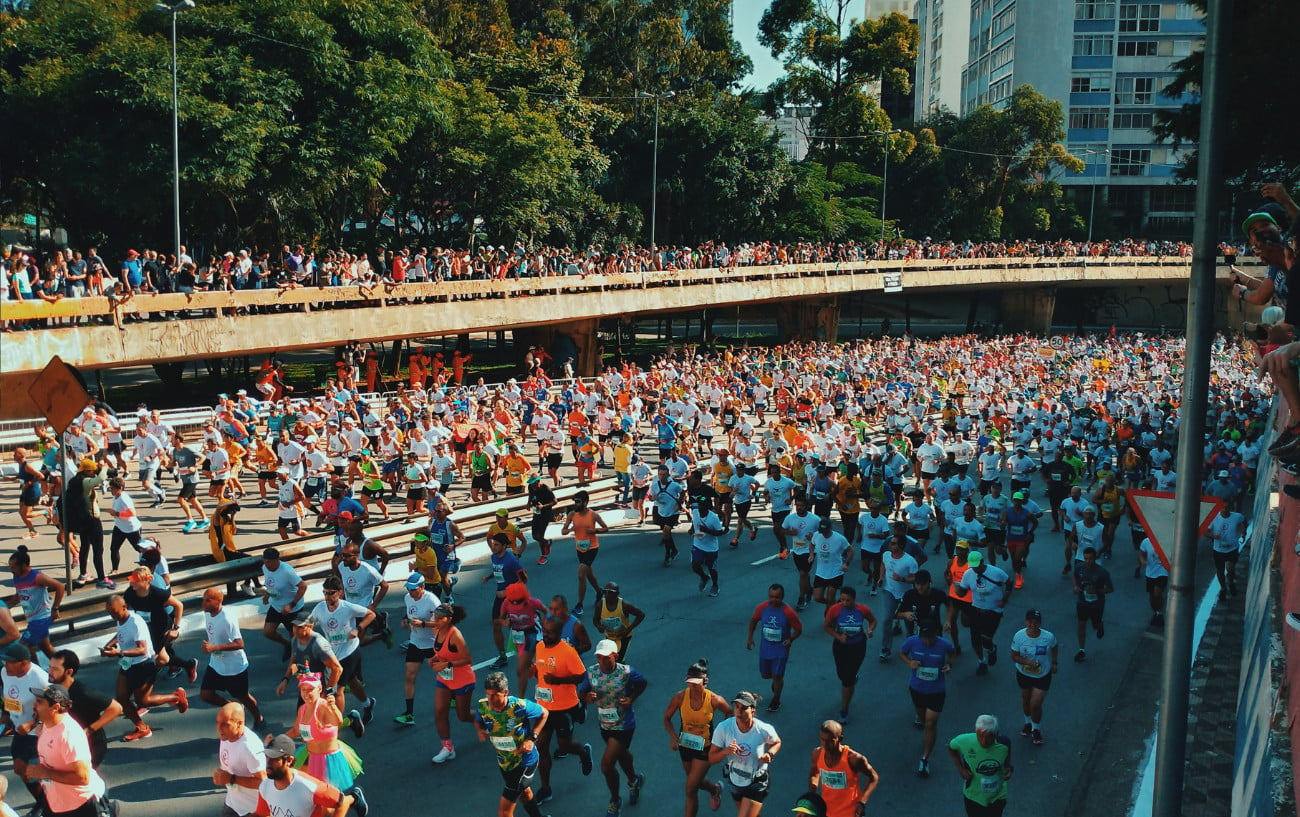
A new review by Daniel Muniz-Pumares and colleagues argues that the marathon can and should be treated as a giant natural experiment.1Muniz-Pumares, D., Maunder, E., Smyth, B., & Hunter, B. (2026). Natural experiments in marathon running. Journal of Applied Physiology. https://doi.org/10.1152/japplphysiol.00792.2025 The researchers do not assign the exposure. Instead, they study what happens when large groups of runners encounter different environments, adopt different behaviors, or arrive with different training histories.
The data are messy and the “experiment” is uncontrolled, but this type of analysis can reveal patterns that a small, tightly controlled study would never be able to detect.
The conclusion is not that big data should replace the laboratory. It is that the two answer different parts of the same question: What actually determines marathon performance in the real world? That’s what today’s newsletter is about.
Critical Speed: The physiological boundary that matters
To understand the marathon, it helps to begin with critical speed.
Critical speed is the speed associated with the upper boundary of sustainable, steady-state metabolism. Run meaningfully faster than this boundary, and you enter the severe-intensity domain, where oxygen uptake continues to rise, important muscle metabolites (like lactate) become progressively disturbed, and exhaustion arrives within minutes rather than hours.
A marathon therefore needs to be run close to, but below, critical speed. The question is how close.
Traditionally, determining critical speed requires several maximal efforts lasting roughly two to 15 minutes. Researchers graph speed against duration and estimate a runner’s maximum sustainable speed (or critical speed) from that relationship. It is informative, but it is also demanding and time-consuming.
Wearable data offer another route. In more than 25,000 recreational runners, researchers estimated critical speed from each runner’s best training performances over distances from 400 to 5,000 meters. The resulting critical-speed estimate predicted marathon performance with an average error of about 7.7%.2SMYTH, B., & MUNIZ-PUMARES, D. (2020). Calculation of Critical Speed from Raw Training Data in Recreational Marathon Runners. Medicine & Science in Sports & Exercise, 52(12), 2637–2645. https://doi.org/10.1249/mss.0000000000002412
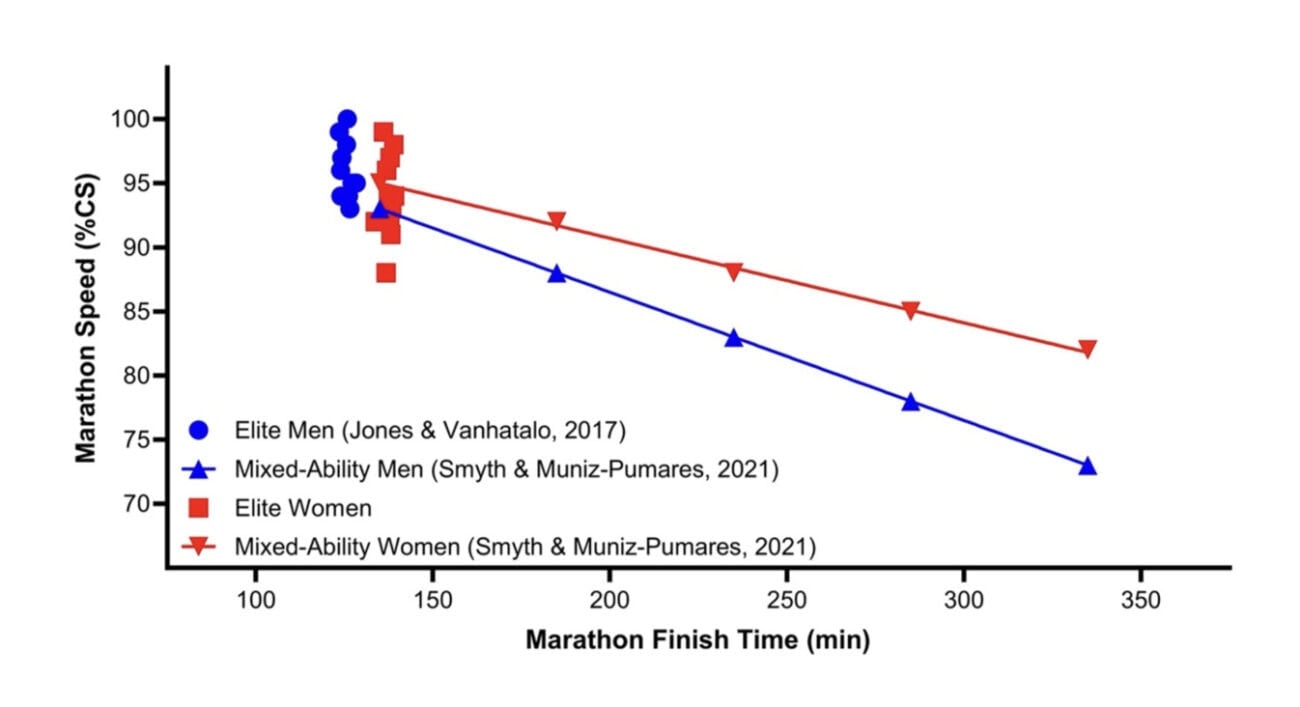
Across the group, runners completed the marathon at roughly 85% of their predicted critical speed. But that average conceals the most interesting result:
- The fastest recreational runners sustained more than 90% of critical speed.
- The fraction declined progressively as finishing time increased.
- Elite runners in separate data completed the marathon at approximately 96% of critical speed.
Faster marathoners, in other words, do not merely have a higher physiological ceiling. They also spend the race closer to it.
That distinction points toward another quality that I’ve talked about a lot in this newsletter: durability.
The marathon exposes durability
Most physiological testing describes an athlete while fresh. A marathon asks whether those same characteristics still exist after two, three, or four hours of running.
That ability to preserve physiological function during prolonged exercise is often called durability. A durable runner experiences less deterioration in the traits that support performance. A less durable runner may look strong in a short laboratory test but lose more of that capacity as fatigue accumulates.
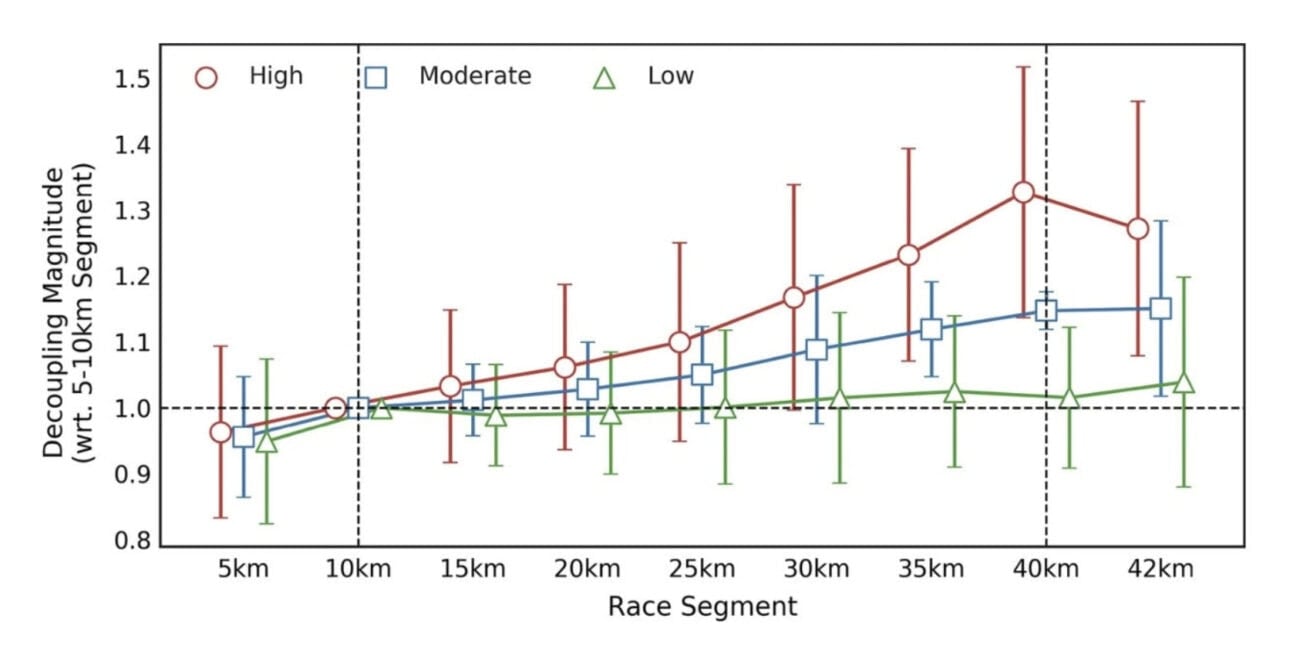
One way to observe this deterioration in the field is to compare internal workload with external workload. Heart rate is the internal cost; speed is the external output. If heart rate rises while speed stays the same—or speed falls despite a similar heart rate—the two measures have “decoupled.”
In an analysis of 82,303 recreational marathoners, runners with high decoupling had a heart-rate-to-speed ratio at the end of the race that was at least 30% higher than during the 5-to-10-kilometer segment. The gap between heart rate and speed widened as the race went on. They finished in an average of 3:58. Runners with low decoupling, defined as an increase of less than 10%, averaged 3:37.3Smyth, B., Maunder, E., Meyler, S., Hunter, B., & Muniz-Pumares, D. (2022). Decoupling of Internal and External Workload During a Marathon: An Analysis of Durability in 82,303 Recreational Runners. Sports Medicine, 52(9), 2283–2295. https://doi.org/10.1007/s40279-022-01680-5
Critical speed alone predicted finishing time with an error of about 6.5%. Adding decoupling improved the prediction, reducing the error to about 5.2%.
So here, among a large group of marathoners, a fresh measure of capacity did not tell the whole story. Knowing how the relationship between effort and output changed during the race improved the ability to predict a runner’s finishing time.
The course becomes part of the physiology
Laboratory studies have long shown that heat and altitude impair endurance performance. Natural experiments tell us how those effects appear across real races—and can detect surprisingly small environmental signals.
Consider three examples from the review:
- Altitude: An analysis of 132,104 elite track-and-field performances found that long-distance performance was impaired even at elevations of 150 to 299 meters, with the penalty accelerating above 1,000 meters. In marathon-specific data, the relationship became clear above roughly 700 meters.
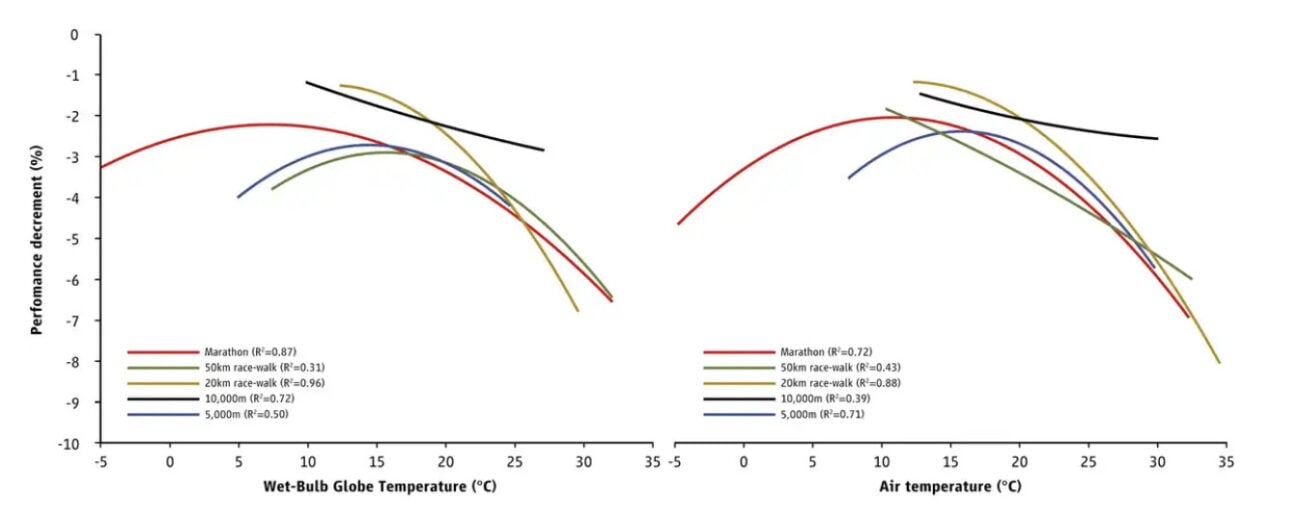
- Heat: Across 7,867 elite athletes competing in 1,258 races, peak endurance performance occurred between 7.5°C (45.5°F) and 15°C (59°F) wet-bulb globe temperature (WBGT), a measure that integrates temperature, humidity, sunlight, and wind. For the marathon specifically, the best performance occurred near 7.5°C (45.5°F) WBGT.
- Air pollution: A study of 2.5 million finishers across 140 marathon event-years found that each 1 µg·m⁻³ increase in fine particulate matter, or PM2.5, was associated with a finishing time roughly 30 seconds slower.
This is where natural experiments are especially valuable. A small controlled trial can explain why heat or reduced oxygen availability changes physiology. A large race dataset can estimate how strongly those conditions matter outside the laboratory, across different courses, athletes, and finishing times.
Human behavior leaves fingerprints in the data
Marathons are physiological events, but they are also a string of personal decisions stretched across 26.2 miles.
An analysis of 1.7 million marathon performances found that both positive splits—slowing in the second half—and negative splits were associated with poorer performance than a more even distribution of pace. The association was especially relevant for recreational runners, who often begin faster than the pace they can sustain.
Then there are goal times.
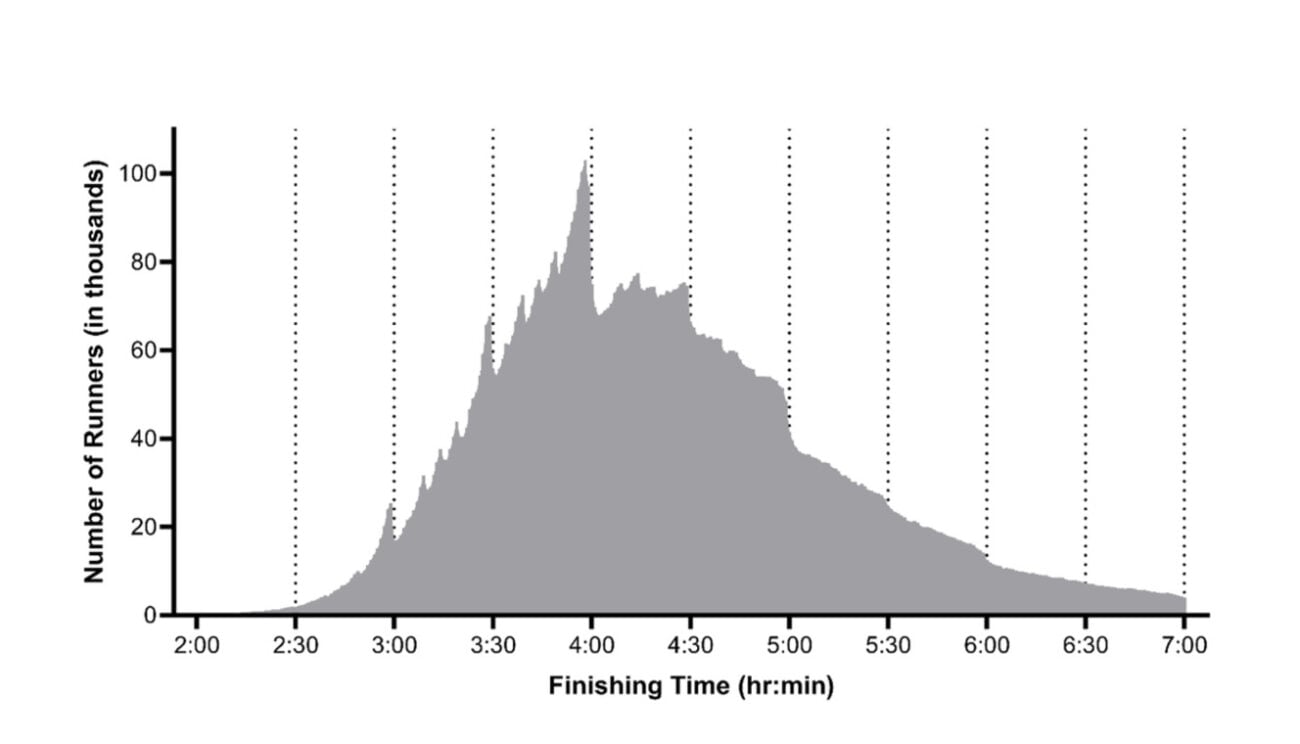
In a dataset of roughly 10 million marathon finishes, finishing times formed conspicuous spikes immediately before familiar targets such as 3:00, 3:30, and 4:00. There were more 2:58s and 2:59s than 3:01s and 3:02s. The physiology of runners does not suddenly change at a round number. But behavior does, and it seems to allow for a finishing kick among those who approach these familiar time targets.
Training data tell a similarly nuanced story. In more than 100,000 marathoners, a pyramidal intensity distribution was the most common pattern at every performance level. That means most training occurred at low intensity, less at moderate intensity, and the smallest amount at high intensity. Faster runners were more likely to follow this pattern, while total sessions, overall distance, and distance accumulated in the moderate exercise-intensity domain strongly predicted subsequent marathon performance.
What this means for runners
The most useful lesson from this review is that marathon performance cannot be reduced to one laboratory number or one training philosophy. But “big data” can provide us with a useful map.
Here is how I would translate the evidence:
- Critical speed (and other estimates like training zones and maximal aerobic capacity) calculated from training data can provide a useful benchmark for race prediction and pacing. But it depends on the quality of the efforts used to build the model. If your “best” short efforts were not maximal, critical speed may be underestimated. If old personal bests no longer reflect current fitness, it may be overestimated.
- A high VO₂ max, strong threshold, or fast critical speed is valuable. So is preserving pace, economy, and physiological control after prolonged running. Pace-heart-rate decoupling can offer one window into that durability, but interpret it in context: temperature, fueling, dehydration, terrain, and accumulated fatigue all affect the relationship.
- Heat, humidity, altitude, and pollution alter the physiological cost of a given pace. A time goal set in cool conditions near sea level may be inappropriate on a warm or elevated course, even when your fitness is unchanged.
- Even pacing remains a sound default, but the appropriate pace must be anchored to your current capacity and race-day conditions. A round-number goal is motivating, but don’t let it tempt you into an overly aggressive first half.
- High volumes of mostly easy running are repeatedly associated with better marathon performance. This review strengthens that pattern, but it does not settle the optimal distribution for every runner or identify the precise dose of moderate- and high-intensity work required.
No single variable wins the marathon. Performance emerges from the interaction among all of them, measured not only in a laboratory while fresh, but across 26.2 miles in the real world.
References
RunClub — Free
Join 300,000+ runners in RunClub
Free training plans for every distance, a daily running game, exclusive coaching content, and a real community of runners. Create your free account in 20 seconds — no card.
Already a member? Log in →











Start the conversation